Blog
How the forecasts are actually made — one indicator at a time. We open up the model tournament, the backtest, the macro laws and the news-sentiment behind each number, and we’re honest about what is easy, what is hard, and where we were wrong.
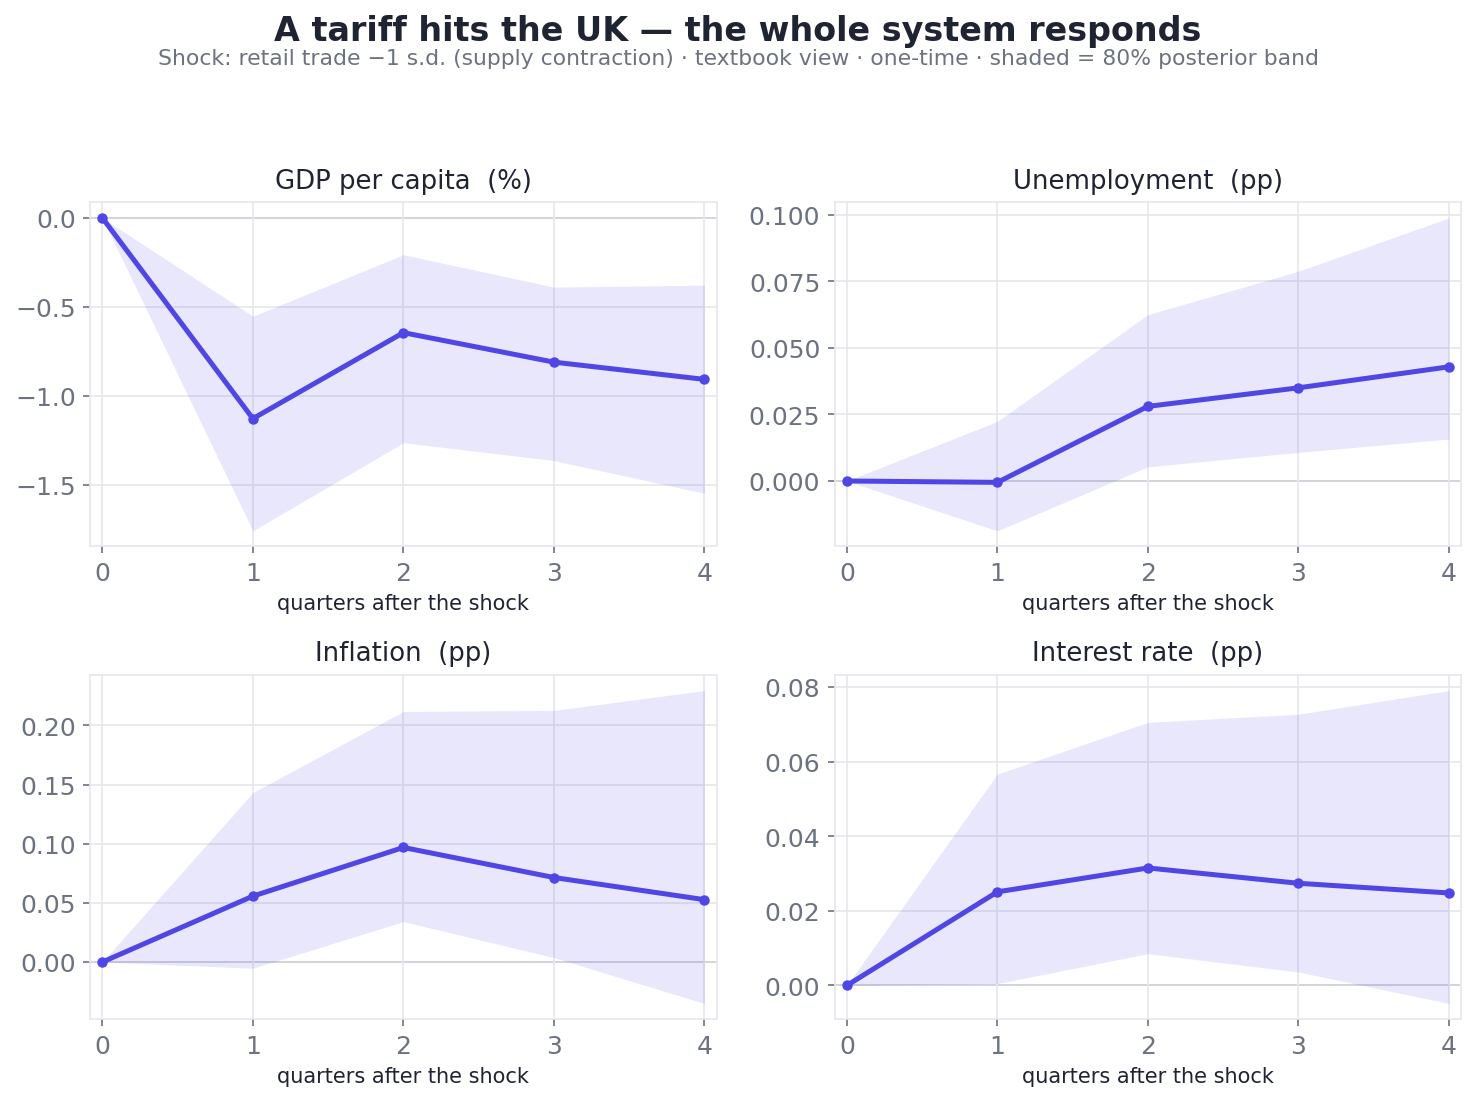
What If? The Question a Forecast Can't Answer — and the Bayesian Engine We Built to Try
Our forecasts tell you the single most likely path. They are silent on the question every decision-maker actually asks: "but what if a tariff lands, or rates jump?" That's a different question — a counterfactual, not a prediction — and it needs a different machine. Here's the Bayesian VAR behind our scenario planner: how it works, the one worked example that shows it earning its keep, and the honest limits of asking 27 quarters of data to play out a hypothetical.
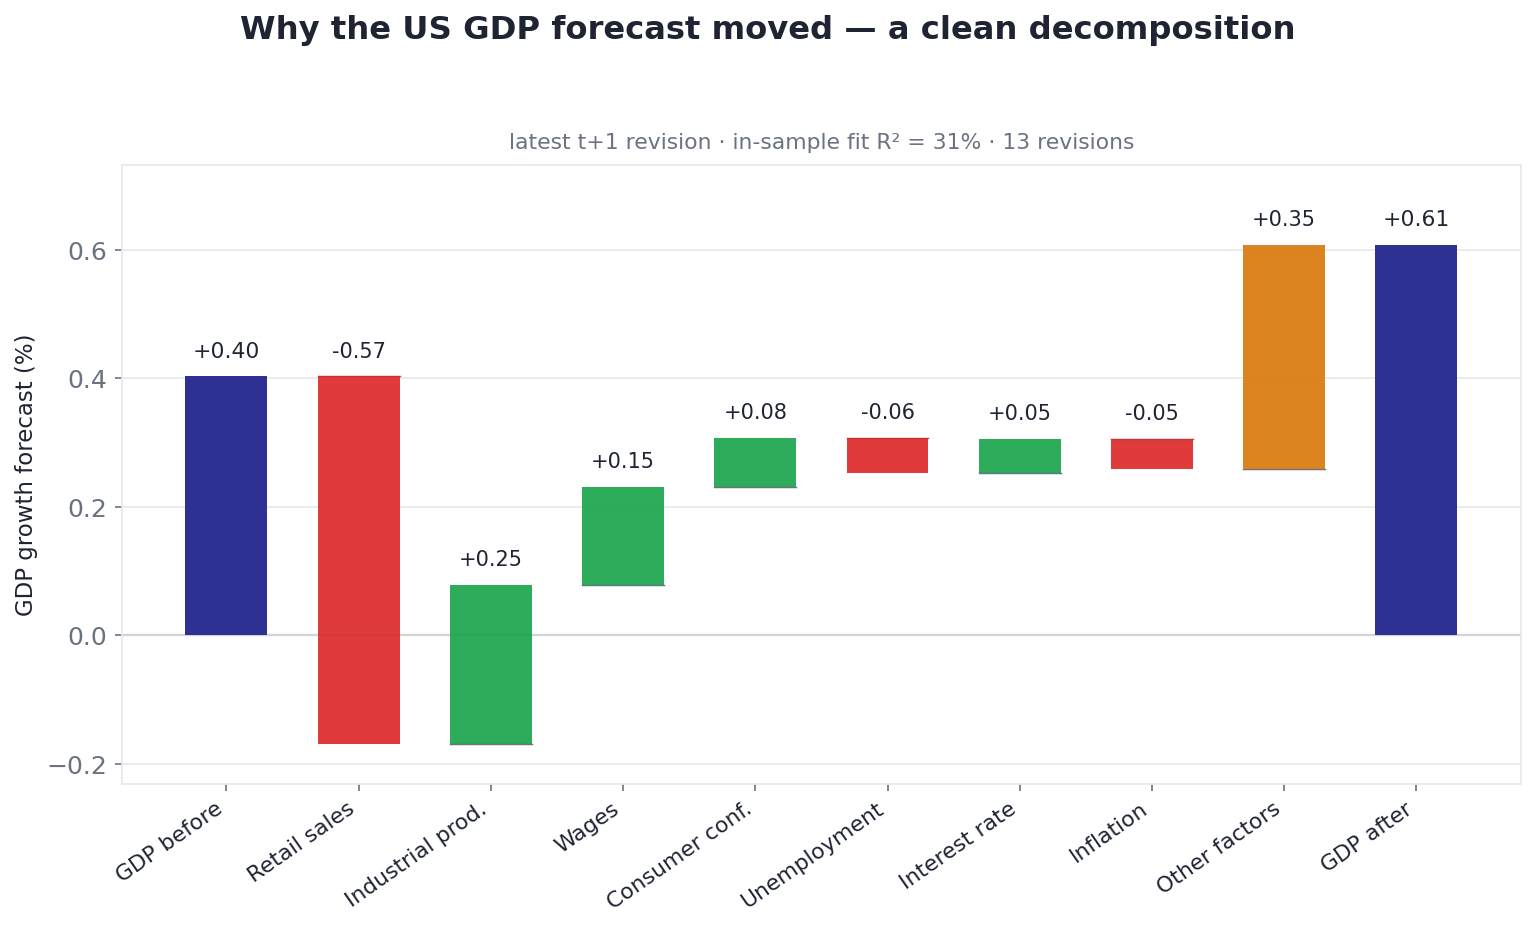
Why Did the Forecast Change? An Honest Attempt to Decompose a GDP Revision
Every time a forecast moves, it raises a question the forecast itself can't answer: why? We built a pilot layer that tries — decomposing a GDP forecast revision into the macro drivers behind it. This is the honest write-up: how it works, the one country where it genuinely earns its keep, and the several where its biggest bar is labelled "we don't know." We're calling it an attempt for a reason.
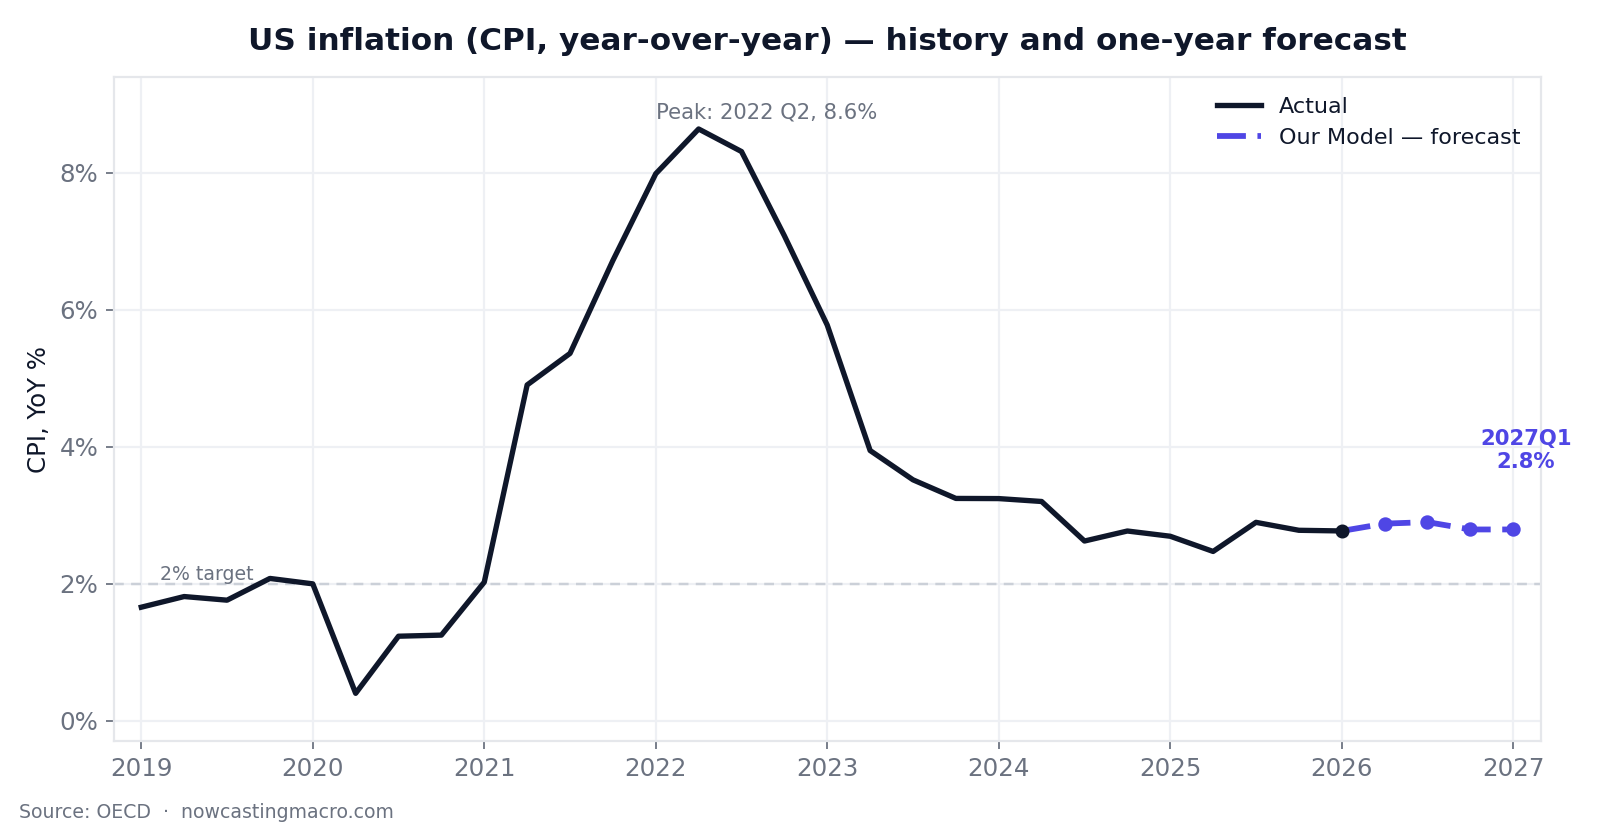
Forecasting the Number Everyone Watched: US Inflation, and Why "Hard" Is the Honest Story
A walk through one of the toughest forecasts on our platform — the US inflation rate that spiked to 8.6% and came back down. Why no single model could tame it, why we average forty of them, and why this is the one place daily news genuinely moves the needle.
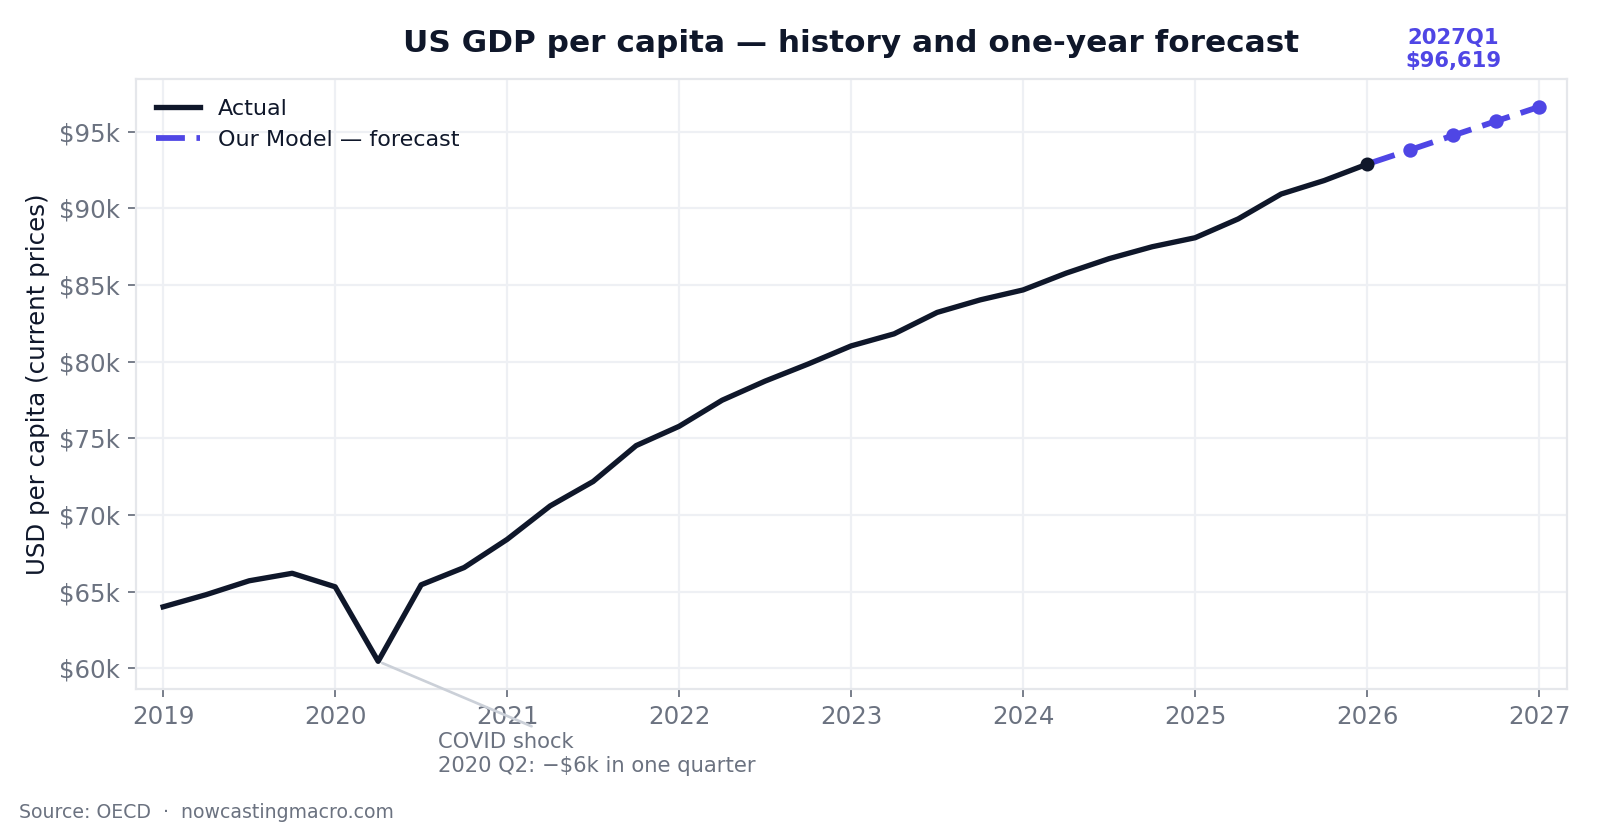
Forecasting a Number That Never Stops Moving: US GDP Per Capita to Within 0.27%
A walk through one of the most accurate forecasts on our platform — a series that climbs almost every quarter, the one model that beat 40 others to track it, why the "smart" models lost, and what honest accuracy actually means.