Forecasting the Number Everyone Watched: US Inflation, and Why "Hard" Is the Honest Story
A walk through one of the toughest forecasts on our platform — the US inflation rate that spiked to 8.6% and came back down. Why no single model could tame it, why we average forty of them, and why this is the one place daily news genuinely moves the needle.
If US GDP per capita is a one-way staircase — a number that climbs almost every quarter and is, frankly, easy to forecast tightly — then US inflation is the opposite kind of problem. It is a rate, not a level. It doesn't trend; it surges, peaks, and reverts. Over the last five years it fell to near-zero in the pandemic, erupted to 8.6% by mid-2022, and has spent three years gliding back down to around 2.8%, where it now hovers just above the Fed's 2% target.
We forecast it one quarter ahead to within about ±0.19 percentage points. That sounds precise, and in absolute terms it is — but on a number sitting near 2.8%, that same error is roughly 7% of the value, twenty-five times larger in percentage terms than our GDP forecast. And that gap is the whole point. Inflation is genuinely hard to forecast, the honest tools say so out loud, and this is exactly the kind of series where the method — and the news — earns its keep.
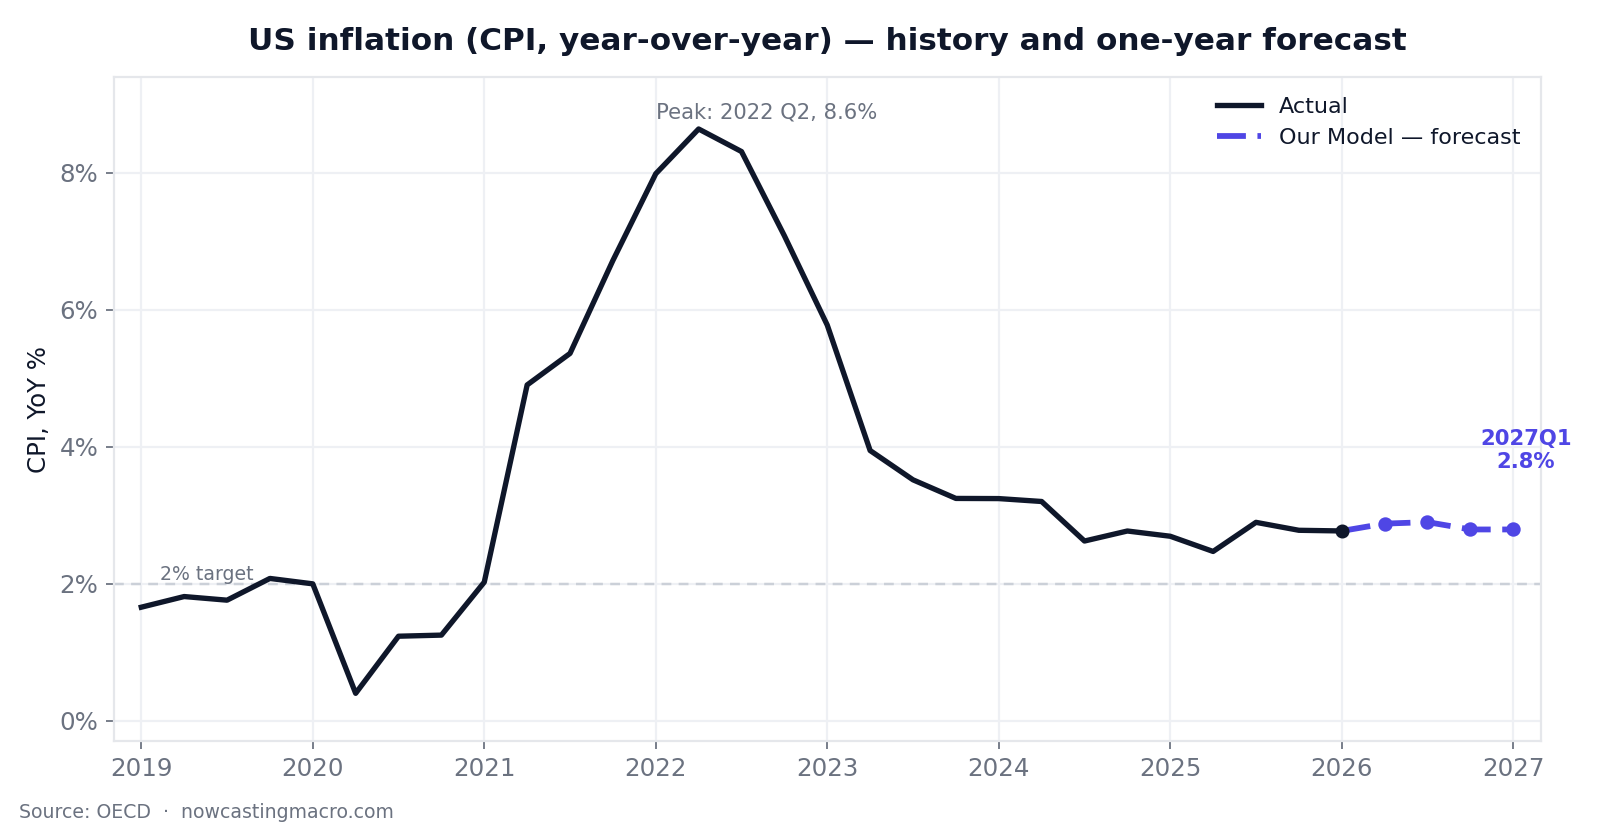
The series everyone lived through: a surge to 8.6% in 2022, a long disinflation, and our forecast (dashed) holding near 2.8% — still above the 2% target. Underlying data: OECD.
The series: a surge, then a long glide
Two features define this series, and they make it the mirror image of a trending level like GDP.
It mean-reverts. Inflation has no permanent direction. It is pulled back toward a central tendency by policy and base effects, so the best forecast of next quarter is not "this quarter plus the recent trend" — it's something closer to "this quarter, nudged toward where inflation tends to settle." A model that blindly extrapolates momentum will overshoot every turning point.
It had one enormous regime change. The 2021–22 surge and the 2023 disinflation were among the fastest moves in modern macro history. No model forecasts a regime change from the data preceding it — and, as we'll see, the single moment our forecast struggled most was exactly the quarter inflation fell fastest.
So the job here isn't to ride a trend faithfully (that was the GDP problem). It's to track a volatile, reverting series without being whipsawed — and to be honest that the error bars are wide.
The tournament: 41 models, and a tight pack
Every series on the platform is forecast the same disciplined way: a walk-forward backtest. Step through history one quarter at a time; at each step every model in the roster forecasts the next quarter using only the data it would have had then; score each on how close it got, out of sample, with no peeking. A model that memorised the past has nowhere to hide.
For US inflation, 41 forecasters entered. But here's what's different from a trending series — no single model runs away with it. The field bunches up:
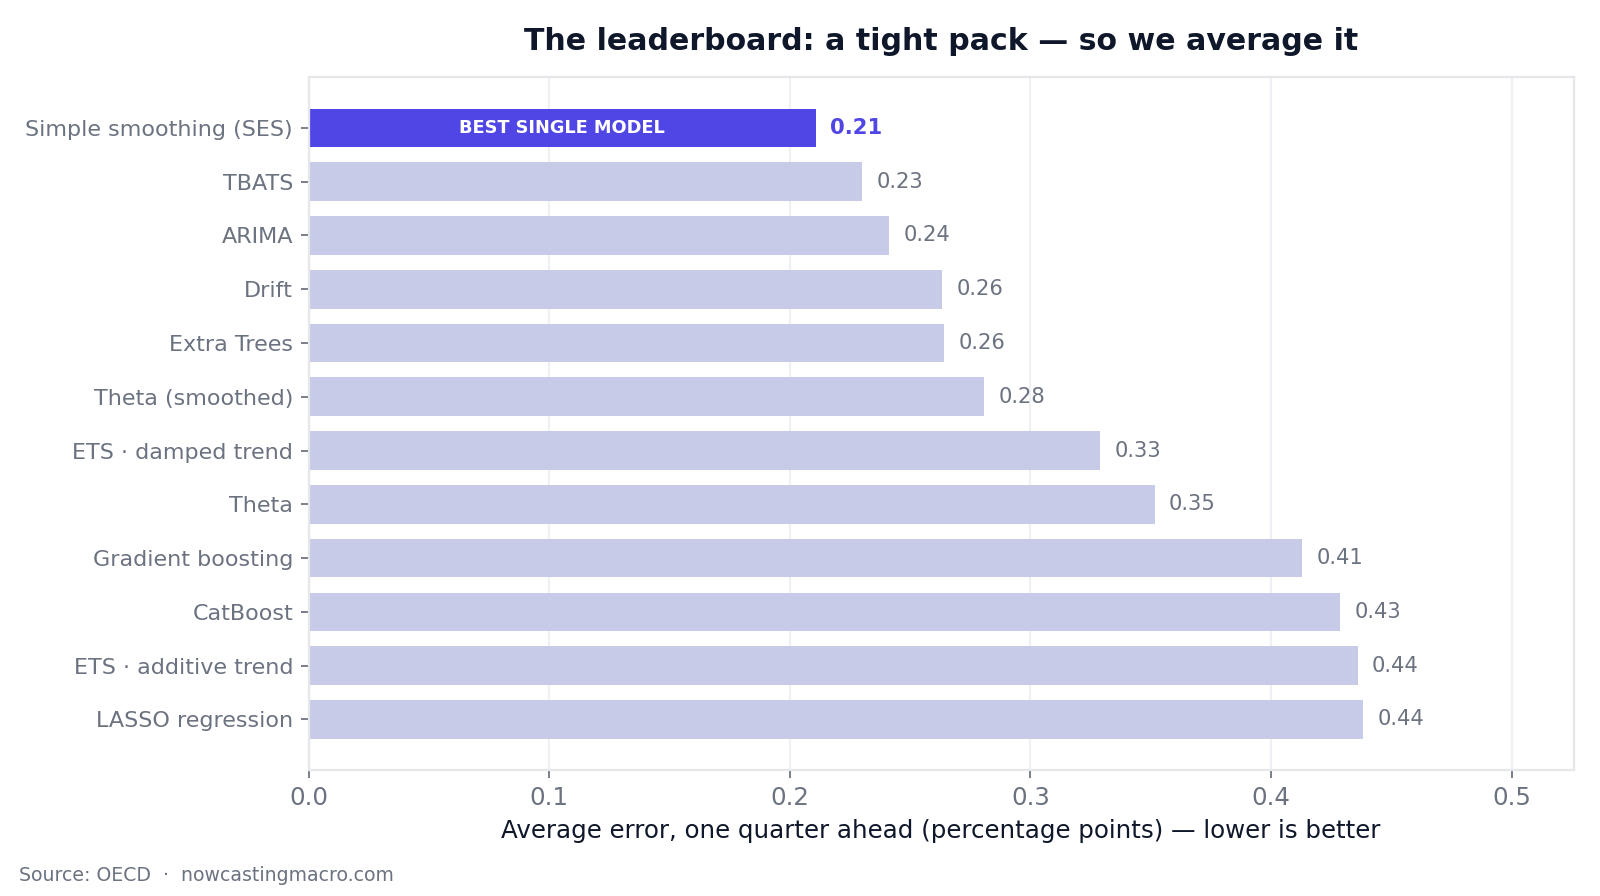
The individual forecasters, bunched between about 0.21 and 0.44 percentage points of error — no single one dominates. Simple smoothing leads the pack of standalone models, but our combined model, which averages the strongest of them, beats every individual forecaster.
On the GDP staircase, one model — damped-trend smoothing — matched the structure so perfectly it swept every horizon. Here, nothing fits that cleanly. Simple exponential smoothing leads the individual models, but only just; a half-dozen others are right behind it, separated by hundredths of a percentage point. When the field is a tight, indistinguishable pack like this, the winning move isn't to crown one of them — it's to average them.
That's exactly what our model does, and it's why it comes out on top. This is one of the most durable findings in forecasting, going back to the M-competitions: when many models are roughly-equally-good and wrong in different ways, averaging cancels their idiosyncratic errors and lands closer to the signal than any single one. On a clean trend you pick the specialist; on a noisy, reverting series you combine the crowd. The walk-forward tournament discovers which situation it's in, per series, and here it chose combine.
(The trees, once again, finished last — gradient boosting at nearly 0.5pp error and worse, because nine-and-twenty quarters is far too little data for a flexible model to find real structure. Short macro samples punish complexity, every time.)
The honest part: where it struggled
A forecast you can trust is one that tells you where it went wrong. For inflation, the answer is vivid:
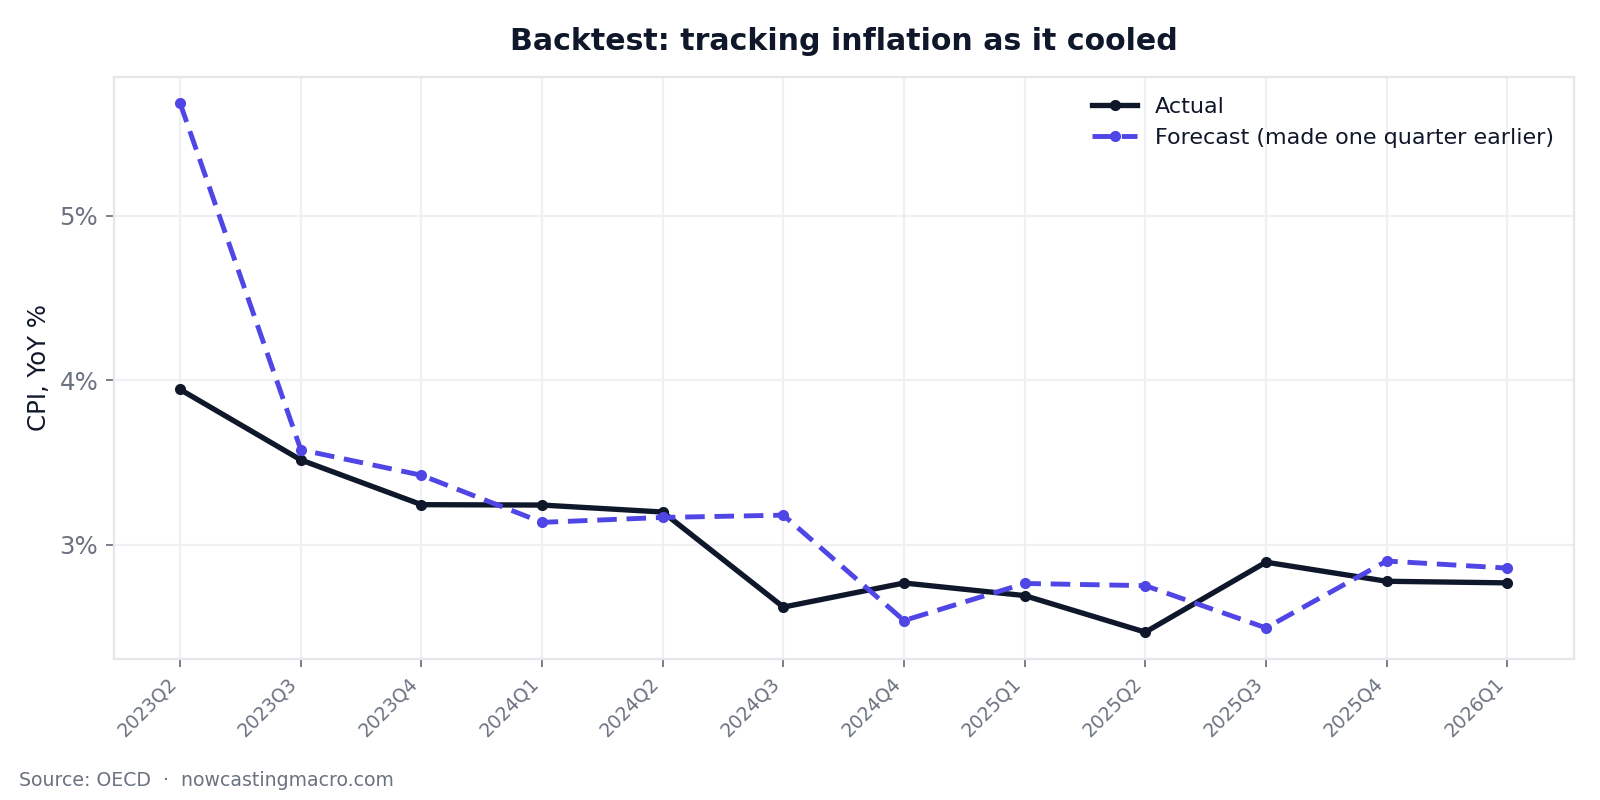
Forecast (dashed) vs. what happened (black). The model tracks the cool-down tightly from 2024 on — but look at the first point: in early 2023 it badly overshot, expecting inflation near 5.7% when it had already dropped to 3.9%.
The single worst miss was the second quarter of 2023 — the model forecast inflation around 5.7% when it came in at 3.9%, a 1.7-point overshoot. That wasn't a bug; it was the disinflation arriving faster than any backward-looking model could anticipate. Inflation was falling so quickly that an estimate built on recent quarters was always a step behind the cliff. Once the descent steadied, from 2024 onward, the forecast snapped back to tracking within a few tenths of a point, quarter after quarter.
That's the honest signature of forecasting a reverting rate: you nail the calm stretches and you lag the turning points, because turning points are, by definition, the moments the past stops being a guide. The ±0.19pp headline accuracy is real — but it's an average that includes both the easy quarters and that one hard one, and we'd rather show you the hard one than hide it.
What the model says happens next
Off the latest reading (2026 Q1 at 2.77%), the forecast is for inflation to stay roughly where it is:
| Quarter | Forecast |
|---|---|
| 2026 Q2 | 2.88% |
| 2026 Q3 | 2.90% |
| 2026 Q4 | 2.79% |
| 2027 Q1 | 2.79% |
In plain terms: sticky, slightly above target, no fresh surge and no return to 2%. Inflation parked in the high-2s for the coming year. But — and this is the crucial difference from the GDP forecast — the model is genuinely unsure about the direction. It puts the odds of a rise next quarter at only about 58%, barely better than a coin flip, fading toward 50/50 further out. That honest uncertainty is what makes the next layer matter.
Anchoring the odds in the news
We don't only read the numbers — every day we collect and score the news about each economy, turning the tone into a single favourable-to-adverse signal. On a near-certain forecast like GDP, that signal has nothing to do; the odds are already pinned. On a coin-flip forecast like inflation, it has real work to do — and this is where the anchor finally earns its keep.
There's a twist worth stating plainly: for inflation, the valence is inverted. A falling CPI is good economic news; a rising one is bad. So our scorer reads "lower oil prices ease price pressures" as positive, and "economists raise their inflation forecasts" as negative — and a run of adverse inflation coverage is, by definition, a signal that prices may be running hotter than the model alone expects.
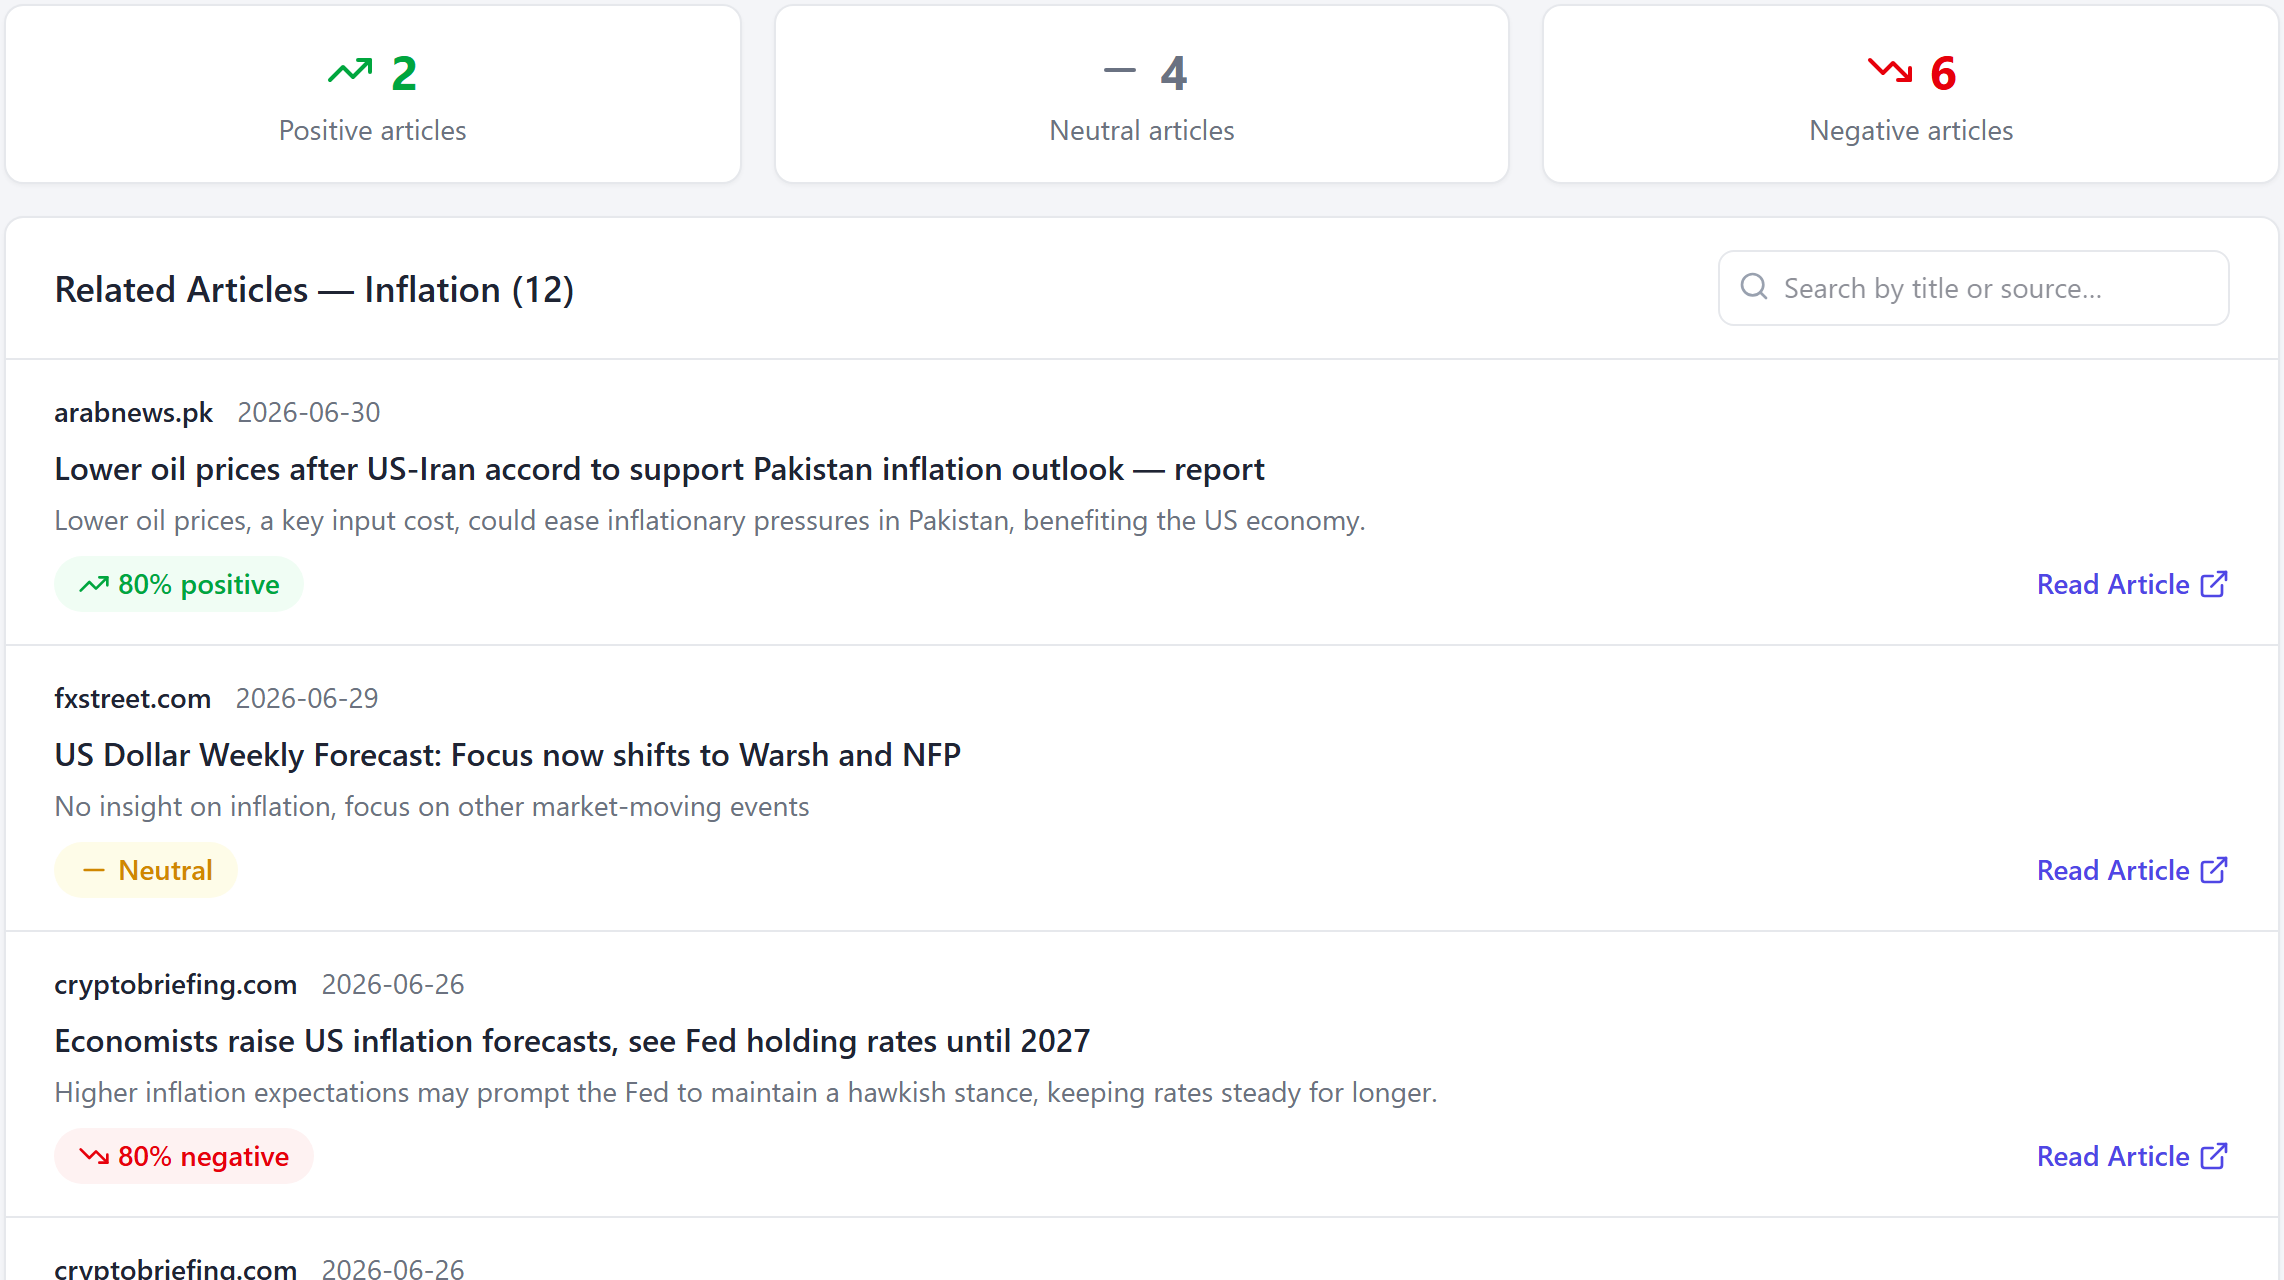
The evidence, counted not asserted. Recent US inflation coverage runs net-negative — two positive, four neutral, six adverse — led by "Economists raise US inflation forecasts, see Fed holding rates until 2027" (scored 80% negative). Note the inverted valence in action: "lower oil prices ease inflationary pressures" scores 80% positive.
Flip the "Model + News" toggle on, and that adverse tone does exactly what it should — it raises the odds that inflation rises:
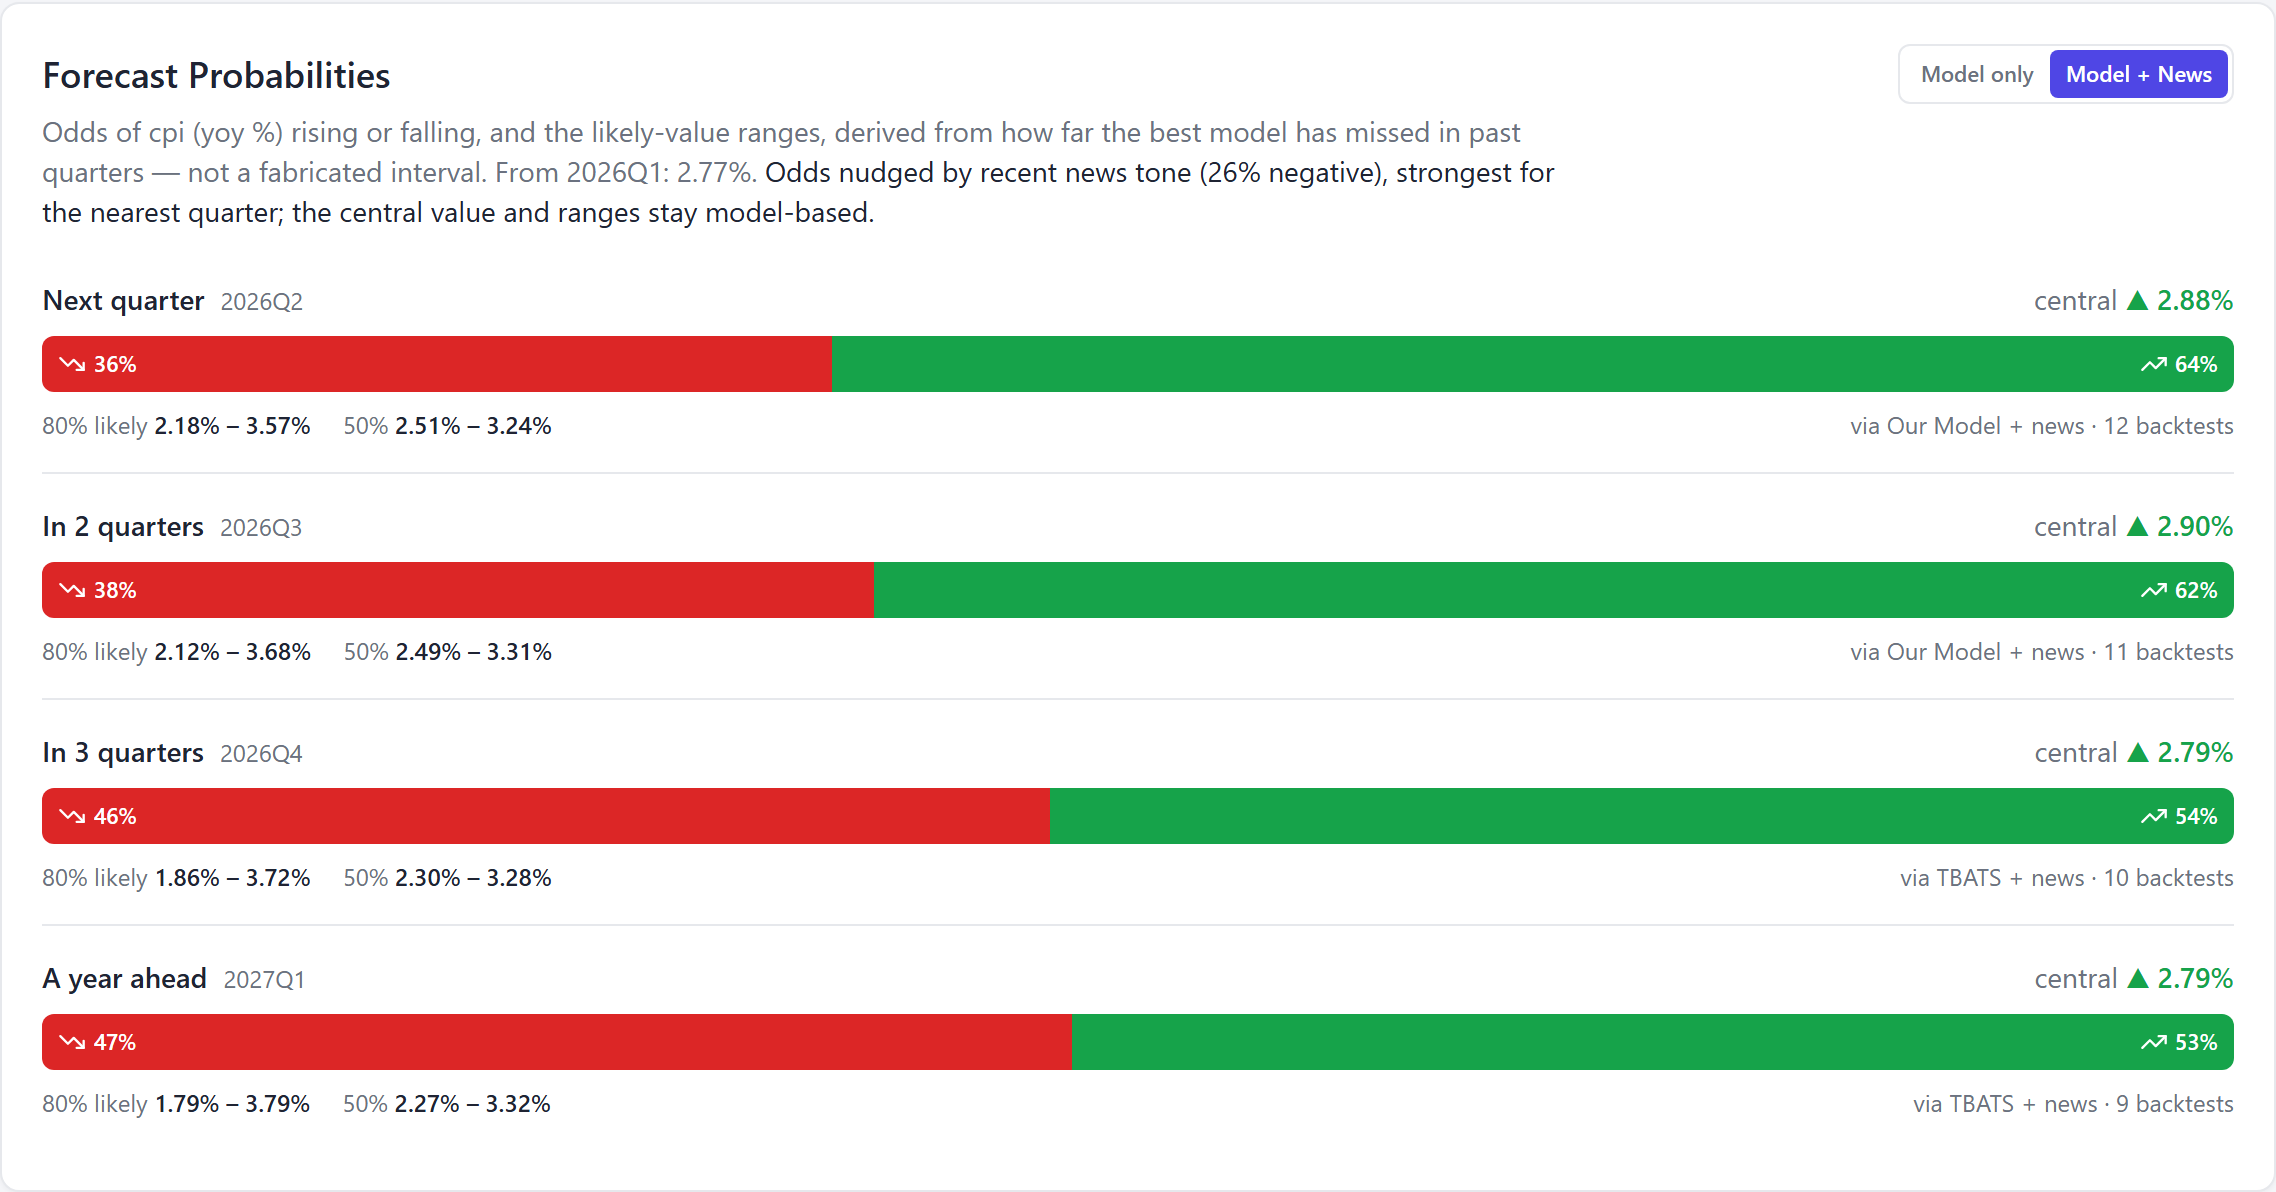
With the news anchor on, next-quarter rise-odds climb from 58% to 64%, and the labels read "via Our Model + news". The nudge decays with horizon — biggest next quarter, almost nothing a year out — and, crucially, the central value and the likely-value ranges don't move. News tilts the *direction, never the number.***
The mechanics are deliberately conservative: news shifts the rise/fall odds as a small Bayesian-style update in log-odds space, capped, and decaying with horizon because sentiment is a near-term signal. Here the −26 (net-negative) inflation tone pushes next quarter's odds of a rise from 58% to 64%, two quarters out from 58% to 62%, and barely moves the year-ahead figure. The central forecast — 2.88% — doesn't budge. This is the same anchor that sat silent on GDP; on a genuinely undecided series, you can watch it work.
The forecast doesn't stand alone
We run two further analytical layers on the same data, and for inflation the natural cross-check is the Phillips Curve — the textbook trade-off between unemployment and inflation (a tighter labour market pushes prices up). For the US it comes out strong:
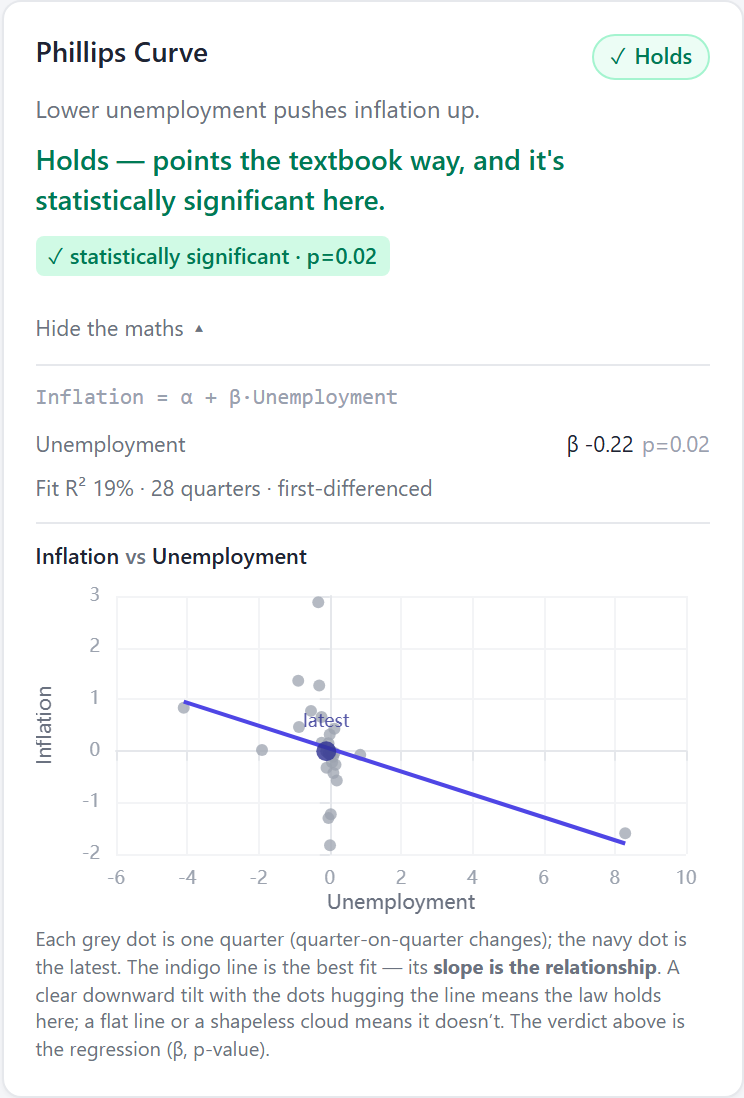
The maths, shown in the product. We estimate Inflation = α + β · Unemployment on the quarter-on-quarter changes: the slope is β = −0.22 (p = 0.02, R² = 19% over 28 quarters). The downward tilt — lower unemployment, higher inflation — is the textbook relationship, and the data supports it. So the inflation series we're forecasting is tied, in a way the data backs, to the labour market.
The Phillips Curve holding doesn't make the forecast more precise, but it tells you the series isn't behaving randomly — it sits inside a coherent macro structure, the same structure the textbooks describe.
See it live
Everything above lives in the product. Here's US inflation inside the platform — pick a horizon, read the nowcast, and see the honest backtested accuracy in plain English ("typically within ±0.19").
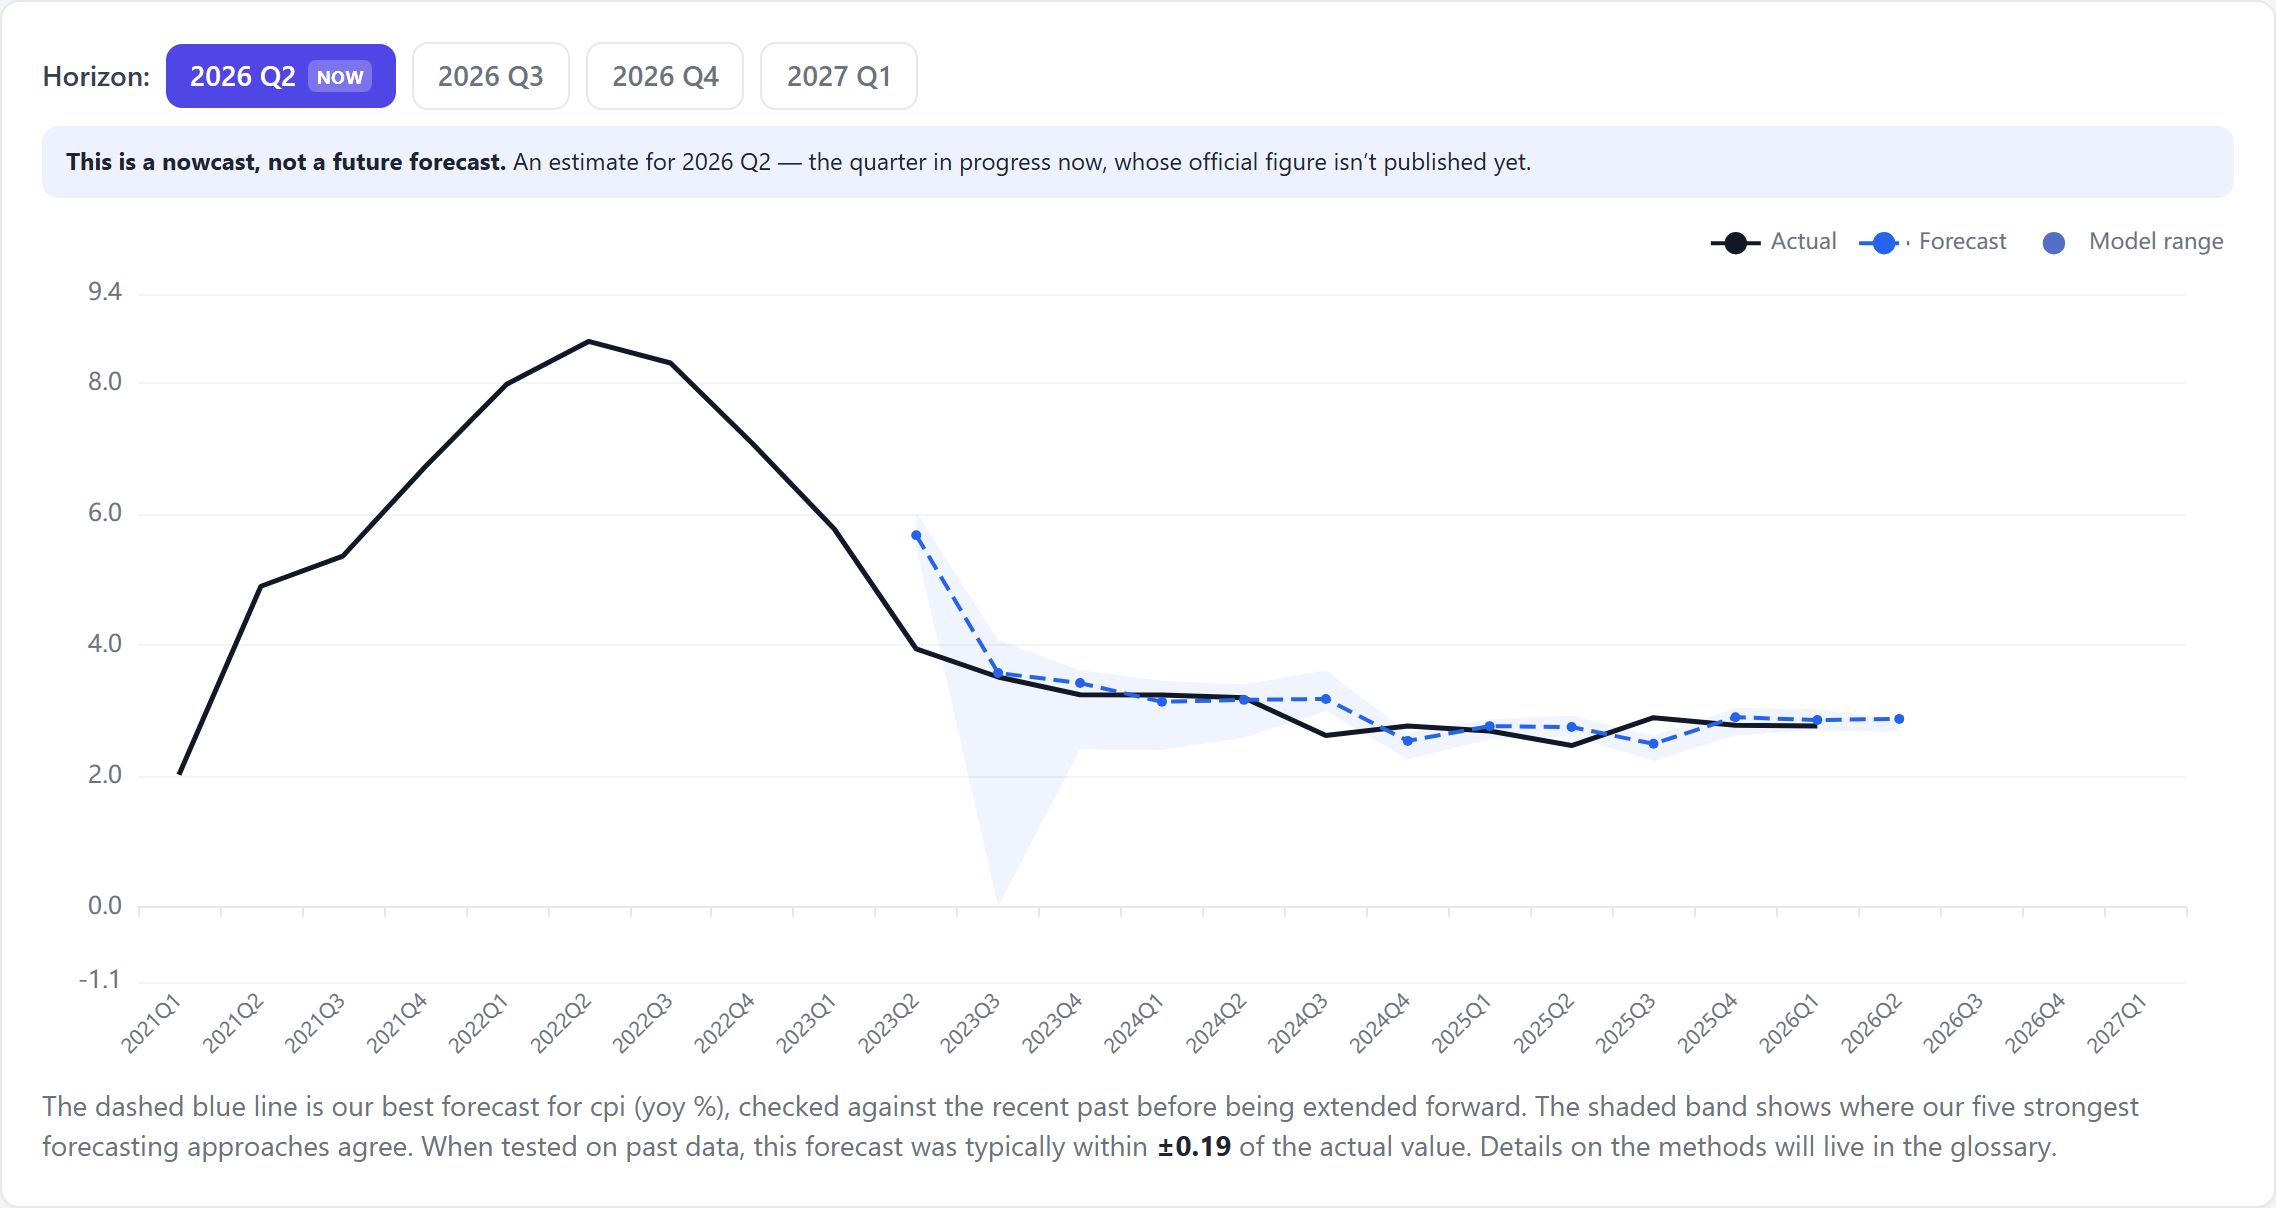
The forecast explorer for US CPI on nowcastingmacro.com. Notice the model-agreement band fans out widest right at the 2023 turning point — the chart is honest about where the forecasters disagreed most.
The takeaway
US inflation is one of the hardest forecasts we make, and that's what makes it worth showing:
- A reverting rate is hard — no permanent trend to ride, and ±0.19pp of error is 7% of a ~2.8% reading. We report that honestly rather than dressing a small absolute number as precision.
- The field bunches, so we average it — no single model dominates a noisy series, and combining a crowd of roughly-equal forecasters beats picking any one. (On a clean trend, the opposite was true — proof we don't apply one recipe to everything.)
- It lagged the one turning point — the fast 2023 disinflation — and tracked the calm stretches within tenths of a point. That's the honest signature of forecasting a reverting series.
- This is where the news matters — because the forecast is a near coin-flip, recent (adverse) inflation coverage measurably tilts the odds of a rise, while leaving the central number untouched. The same anchor that sat silent on near-certain GDP does real work here.
- The structure holds — the Phillips Curve is intact in the US data, so the series sits inside coherent macro logic.
Good forecasting isn't about parading the smallest number. It's about matching the method to the series, proving it out of sample, showing you the quarter you got wrong, and being clear about how much is genuinely uncertain. Inflation is the series that demands all of that at once.
This was one series in one country. The same 41-model tournament, walk-forward backtest, and news-anchored probabilities run for every indicator we track — GDP, inflation, unemployment, interest rates, business and consumer confidence, industrial production and retail trade — across 11 major economies: the United States, United Kingdom, Germany, Japan, Canada, Australia, China, India, Brazil, Saudi Arabia and South Africa. Explore the full grid at nowcastingmacro.com.
See the live forecasts, backtests and news-sentiment for every indicator across 11 major economies.
Explore the platform