What If? The Question a Forecast Can't Answer — and the Bayesian Engine We Built to Try
Our forecasts tell you the single most likely path. They are silent on the question every decision-maker actually asks: "but what if a tariff lands, or rates jump?" That's a different question — a counterfactual, not a prediction — and it needs a different machine. Here's the Bayesian VAR behind our scenario planner: how it works, the one worked example that shows it earning its keep, and the honest limits of asking 27 quarters of data to play out a hypothetical.
A forecast is a single answer to a single question: what is the most likely next value? Our GDP and inflation models answer that one well — within a few tenths of a point, quarter after quarter. But sit in any boardroom or central bank and the question in the air is rarely "what's the point forecast?" It's "what happens to us if X happens?" What if the US hikes rates again? What if a tariff hits retail? What if an inflation shock spreads across borders?
No point forecast can answer that. A forecast extrapolates the path the world is already on; a scenario steps off that path on purpose and traces the consequences. The two are complements, not competitors — and the scenario question needs a model that understands how the whole economy moves together, not one variable at a time.
That model is a Bayesian Vector Autoregression — a BVAR — and it powers the scenario planner on the platform. This is the story of how it works, and, just as importantly, where it stops being trustworthy.
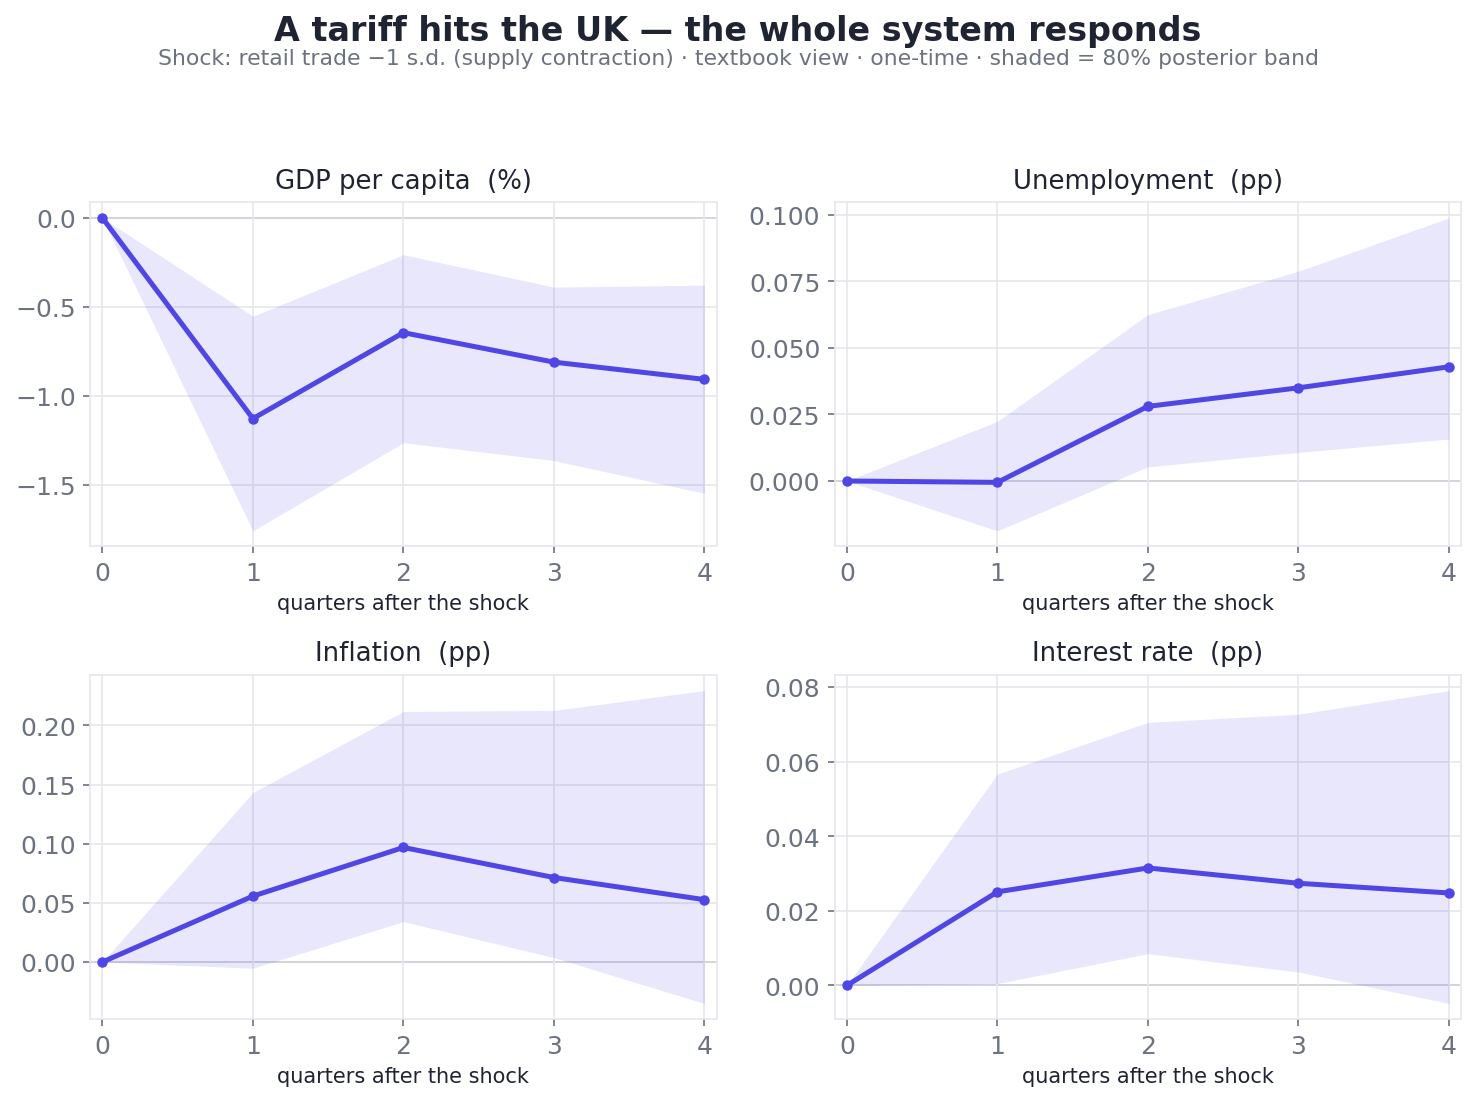
The core object: shock one variable, watch every other variable respond over the next year. Here a tariff (a fall in UK retail volume) ripples into GDP, unemployment, inflation and interest rates — the supply-side stagflation pattern, traced quarter by quarter with honest uncertainty bands. Underlying data: OECD.
Why a system, not a series
Every other model on the platform forecasts one series in isolation: US inflation, UK GDP, each in its own lane. That's the right tool for prediction. It's the wrong tool for a scenario, because scenarios are about transmission — the way a shock to one variable travels through all the others.
A Vector Autoregression is the simplest honest model of that transmission. Instead of "next quarter's inflation depends on past inflation," it says "next quarter's entire macro vector — growth, inflation, unemployment, rates, confidence, retail — depends on the recent history of all of them, together." Estimate that web of cross-dependencies, and you can do something a single-series model never can: poke one variable and watch the rest react, in sequence, the way a real economy does.
Our system tracks seven core variables — GDP per capita, inflation, unemployment, the long-term interest rate, business and consumer confidence, and retail trade volume. Seven variables, each depending on the others, is already a lot of relationships to pin down. And here is the catch that defines everything that follows: we are trying to estimate that dense web from about 27 quarters of data. Seven years. That is nowhere near enough for a textbook VAR, which would happily fit the noise and hand you nonsense. So we don't fit a textbook VAR.
The "Bayesian" in BVAR: discipline by prior
The fix is the Bayesian part, and it's the heart of the method. Rather than let the data speak unchecked on a sample far too short to trust, we anchor the estimate with a prior — a set of beliefs the model holds before it sees the country's data, which the data then updates.
We use two priors, layered:
A Minnesota prior — the classic VAR regularizer. It gently pulls every coefficient toward "this variable mostly follows its own recent past, and distant lags matter less than recent ones." It's humility encoded as math: absent strong evidence, assume the boring, persistent dynamics rather than elaborate cross-effects. On a short sample, that restraint is exactly what keeps the model from chasing ghosts.
An empirical-Bayes global prior — the more unusual ingredient. Before fitting any single economy, we pool the economies that do have a full, clean data panel (Germany, the UK, Japan, the US — our "donors") into one global VAR, a consensus picture of how a developed economy tends to move. Every individual country is then estimated as a deviation from that global consensus, shrinking toward it where its own data is thin. A country with a strange-looking quarter doesn't get to rewrite macroeconomics on the strength of it; it gets nudged back toward what the wider panel says is normal.
The pay-off of going Bayesian is not just stability — it's that the posterior is closed-form. Because the priors are conjugate, we can write down the exact posterior distribution and draw from it directly — 2,000 samples per economy — with nothing more than NumPy and SciPy. No MCMC, no sampler to babysit, no convergence diagnostics. On ~27 quarters the marginal gain from full hierarchical MCMC is negligible, so we don't pay for it.
Two views: what the data says vs. what theory says
Here's where the planner does something most VARs don't. A raw VAR tells you what the data implies — correlations and all, including the accidental ones a short, COVID-scarred sample is riddled with. That's useful, but it isn't always sensible. So every scenario is offered in two views, and the toggle between them is the most important control on the page.
- Data view. The unrestricted model, identified the standard recursive (Cholesky) way. It tells you what the historical correlations imply — warts, quirks and all.
- Textbook view. The same 2,000 posterior draws, but screened to keep only those whose responses obey the signs that economic theory predicts. A rate hike should cool inflation and lift unemployment; draws where it does the opposite (an artefact of the short sample) are filtered out. What survives is a sign-restricted structural VAR — the data's dynamics, disciplined by the textbook.
The two genuinely disagree, and the disagreement is informative. Take a UK interest-rate hike: the unrestricted data view shows unemployment falling (a spurious correlation from the sample), while the textbook view shows it rising and inflation easing harder — the relationship the theory, and common sense, expect. We show you both and let you choose how much to trust the raw data over the textbook.
The textbook view is built on a single coherent supply-side framing. A contraction in activity — a tariff, a geopolitical shock, an inflation surge — is read as a supply shock: output, confidence and employment fall while prices and rates rise. One story, applied consistently, rather than a tangle of demand-vs-supply toggles.
A worked example: a tariff hits the UK
Abstractions are cheap; let's run one. Pick the UK, shock retail trade down by one standard deviation — a stand-in for a tariff squeezing the supply side — and read the textbook view a full year out. The system responds with a textbook-clean stagflation pattern:
| UK response, one year on | Direction | How likely (posterior) |
|---|---|---|
| GDP per capita | down | ~99% |
| Unemployment | up | ~99.8% |
| Business confidence | down | ~95% |
| Interest rate | up | ~85% |
| Inflation | up | ~76% |
| Consumer confidence | down | ~56% (barely) |
Growth and jobs hit, confidence sapped, prices and rates pushed up: the coherent stagflation signature of a supply shock, every channel pointing the way theory says it should — except consumer confidence, which the model genuinely can't call (a near coin-flip, and we show it as one).
That last row matters as much as the rest. Five of the six channels resolve cleanly and in the textbook direction; one — consumer confidence — comes out a near coin-flip, and the planner reports it as one rather than dressing a 56% in confident clothing. A scenario tool you can trust is one that tells you which of its own answers are firm and which are guesses.
A word on units. The planner shocks in standard deviations, on purpose: it's the natural, unit-free scale, so a "1-SD shock" means the same kind of jolt whether you're moving inflation or retail, and the responses are directly comparable across variables. For readability the product also translates them back to natural units — roughly 0.9% lower GDP per capita and a few hundredths of a point more inflation and unemployment for this UK tariff over the year — but the standard-deviation scale is what keeps the cross-variable comparison honest.
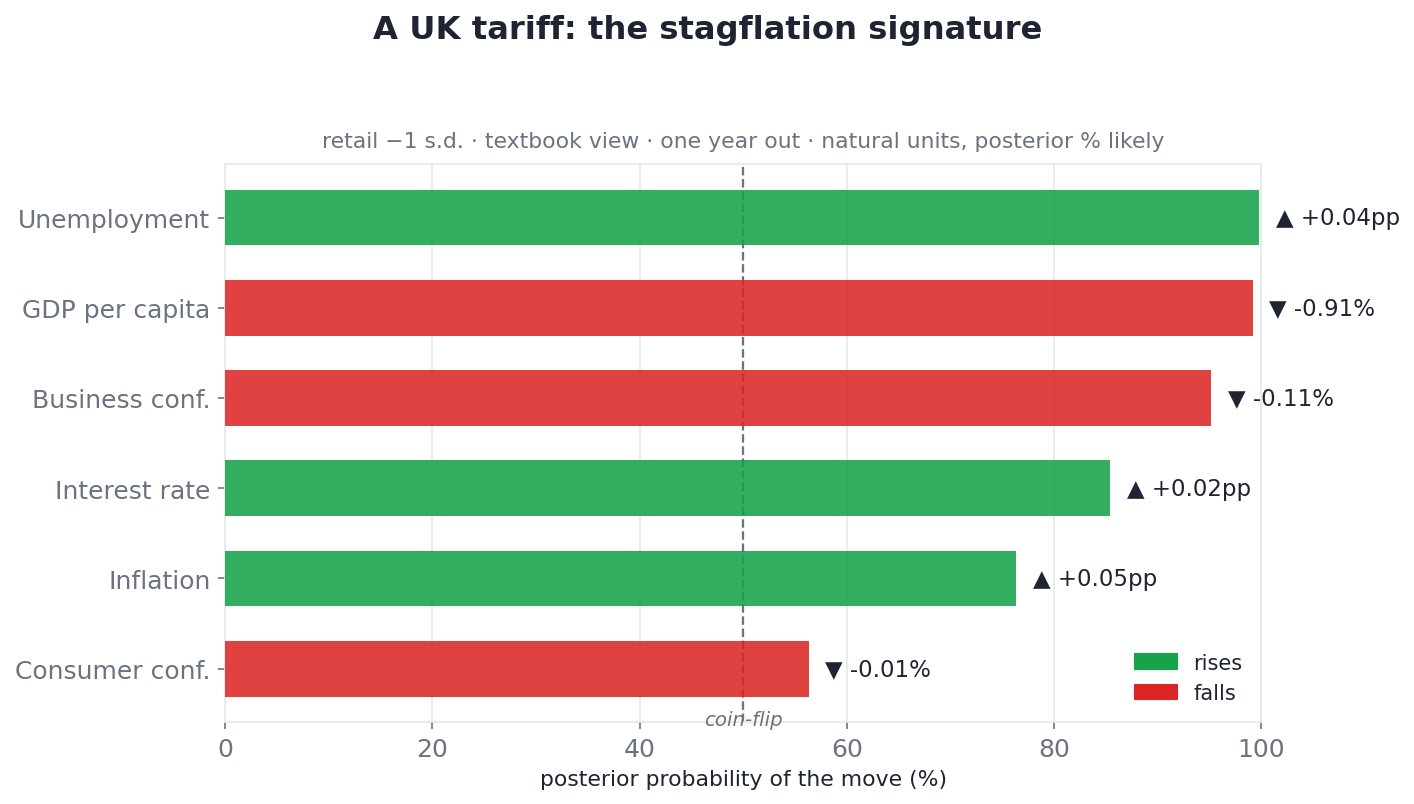
The Bayesian alternative to a p-value. Because we draw the full posterior, we can simply count: of 2,000 scenario draws, what share send each variable up versus down? That share — the posterior sign-probability — is the honest "% likely," and it's what separates a channel the model is sure about (unemployment, ~99.8%) from one it isn't (consumer confidence, ~56%).
Crossing borders: spillovers
Shocks don't respect borders, so neither does the planner. Alongside each domestic scenario it estimates bilateral spillovers — what a shock at home does to a partner economy — from a stacked two-country VAR in which the cross-border links start at a prior of zero. They only light up if the data genuinely supports them, so a spillover you see is one the evidence insisted on.
Shock US interest rates up and read the effect on the UK a year out, and the transmission is exactly what a financial economist would sketch on a whiteboard:
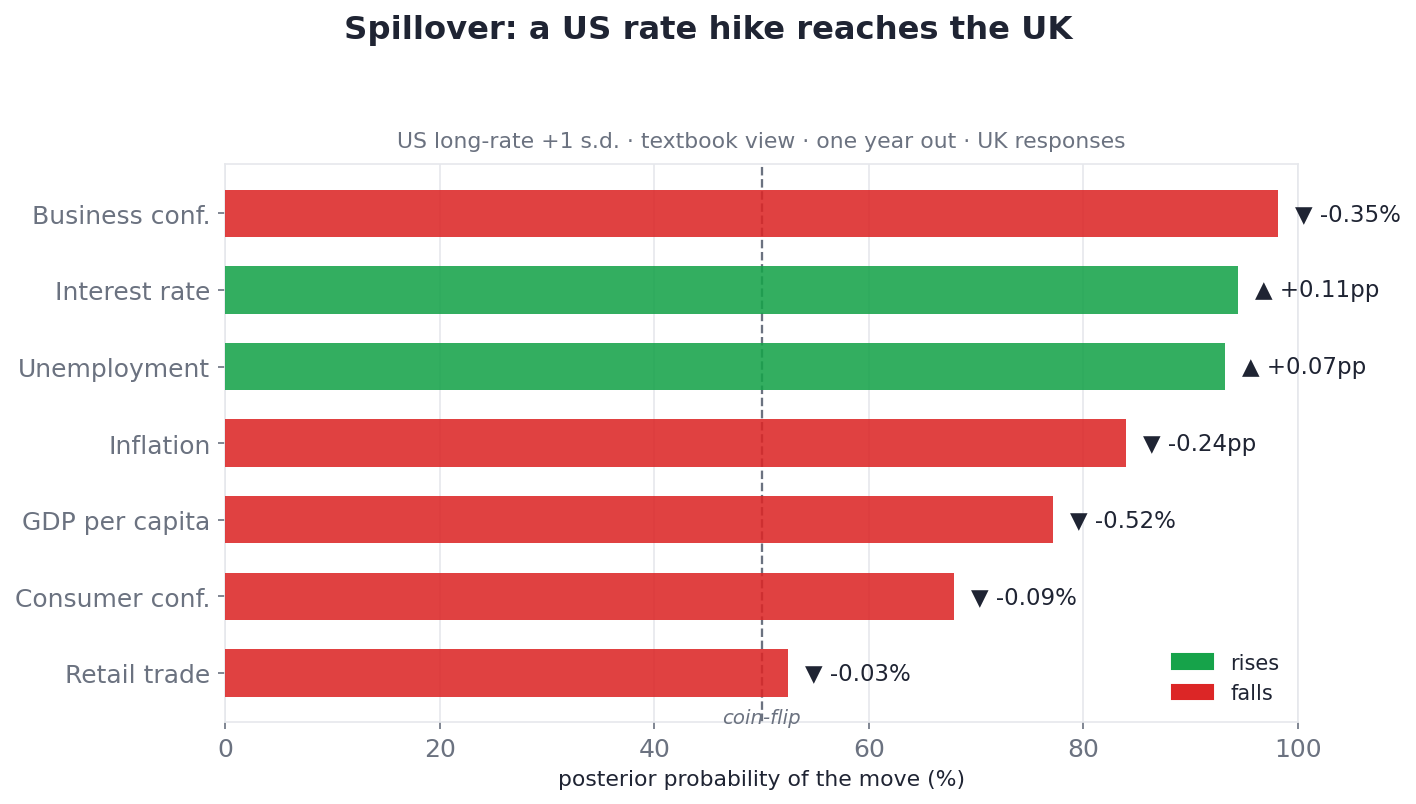
Tighter US policy drags UK financial conditions with it: UK rates follow (~94% likely), business confidence and growth soften (~98%, ~77%), unemployment edges up (~93%), and inflation eases (~84%). Retail and consumer confidence barely move — and the model says so. A coherent cross-border channel, not an asserted one.
This is a deliberately conservative spillover, not a full global model with trade weights — it's directional on a short sample, and we frame it that way. But the fact that it reproduces the classic dollar-cycle transmission without being told to is the reassurance that the machinery underneath is sound.
The honest part: 8 economies, borrowed strength, and a 27-quarter sample
Now the limits, stated plainly — because a scenario tool that hides them is worse than none.
It fits 8 economies, not all of them. The planner needs at least five of its seven core variables present to fit a country at all. Eight clear the bar: the US, UK, Germany, Japan, Canada, Australia, Brazil and South Africa. The variables a country is missing aren't invented from thin air — they're proxied from the global prior, filled in with the consensus relationship the donor economies imply, and then flagged in the UI as "proxied from the global model" so you always know which lines are the country's own data and which are borrowed. China and India fall out entirely once GDP-per-capita enters the core, because that series simply doesn't exist for them — a real cost, shown rather than papered over.
The sample is short and scarred. Twenty-seven quarters, several of them the COVID crater and its rebound. We chose a deliberately parsimonious VAR(1) — one lag, a one-year horizon — precisely because richer specifications fit that scar tissue and produced oscillating, untrustworthy responses. Parsimony here is not laziness; it's the only honest choice on a sample this size.
These are scenarios, not forecasts. The whole platform's forecasts come with backtested, out-of-sample accuracy figures — "typically within ±0.19." The scenario planner has no such number, and it would be dishonest to manufacture one, because a counterfactual never happened, so there is nothing to score it against. What the planner offers instead is internal coherence and calibrated uncertainty: directions that obey economic logic, and a posterior probability on every one so you can see exactly how firm each call is. It is a disciplined way to reason about "what if," not a claim to know the future of a world that took a different turn.
See it live
Every chart above is generated from the live model — the same engine that drives the scenario planner inside the product. There, it's interactive and a few clicks deep: the tab opens on a current-risks banner (today's worries wired up as one-click presets — "Geopolitical risk → global inflation shock," "Tariffs → retail-trade shock"), and from there you pick any economy, any shock, dial the size, flip the direction (▲/▼), choose a one-time hit or a shock sustained every quarter, and toggle between the data and textbook views. Each response comes as a fan chart with its uncertainty band and its "% likely" — exactly the small-multiples and probability bars you've seen here, live. It sits behind the login at nowcastingmacro.com.
The takeaway
The scenario planner is the platform's answer to the question a forecast structurally cannot address — what if? — and the way it's built is the point:
- A scenario needs a system, not a series. Single-variable forecasts can't model transmission; a seven-variable VAR can poke one channel and trace the rest.
- Bayesian priors make a short sample usable. A Minnesota prior plus an empirical-Bayes global prior keep a 27-quarter VAR from chasing noise — and a conjugate posterior lets us sample it directly, no MCMC.
- Two views, honestly labelled. The data view shows what the correlations imply; the textbook view screens them to economic theory. They disagree, and the disagreement is information.
- It tells you how sure it is. Every response carries a posterior sign-probability — the honest "% likely" — that cleanly separates the channels the model is confident about from the ones it can't call.
- It owns its limits. Eight economies, missing variables visibly proxied, a parsimonious VAR(1), and — crucially — these are scenarios, not forecasts, with no backtest score because counterfactuals can't have one.
Good scenario analysis isn't about pretending to know an alternate future. It's about reasoning from data with discipline, being explicit about which conclusions are firm, and never letting a confident-looking chart outrun the 27 quarters of evidence underneath it.
The scenario planner is one of three analytical layers we run on the same macro data, alongside the macro laws (textbook relationships estimated per country) and the forecast-attribution pilot (why a forecast changed). They sit beside the core engine: a 41-model forecasting tournament, walk-forward backtested and news-anchored, running for every indicator we track across the major economies — the United States, United Kingdom, Germany, Japan, Canada, Australia, China, India, Brazil, Saudi Arabia and South Africa. Explore it all at nowcastingmacro.com.
See the live forecasts, backtests and news-sentiment for every indicator across 11 major economies.
Explore the platform