Forecasting a Number That Never Stops Moving: US GDP Per Capita to Within 0.27%
A walk through one of the most accurate forecasts on our platform — a series that climbs almost every quarter, the one model that beat 40 others to track it, why the "smart" models lost, and what honest accuracy actually means.
US GDP per capita is a number that never sits still. It has risen from about $64,000 at the start of 2019 to roughly $92,900 today. And our one-quarter-ahead forecast lands, on average, within $240 of it — a mean error of just 0.27% on a near-$90,000 figure.
That's a result worth pulling apart, because the model isn't being handed a flat line to copy. It has to chase a moving target up a near-vertical staircase — and stay glued to it, quarter after quarter. Here's exactly how that works, and where the honesty lives.
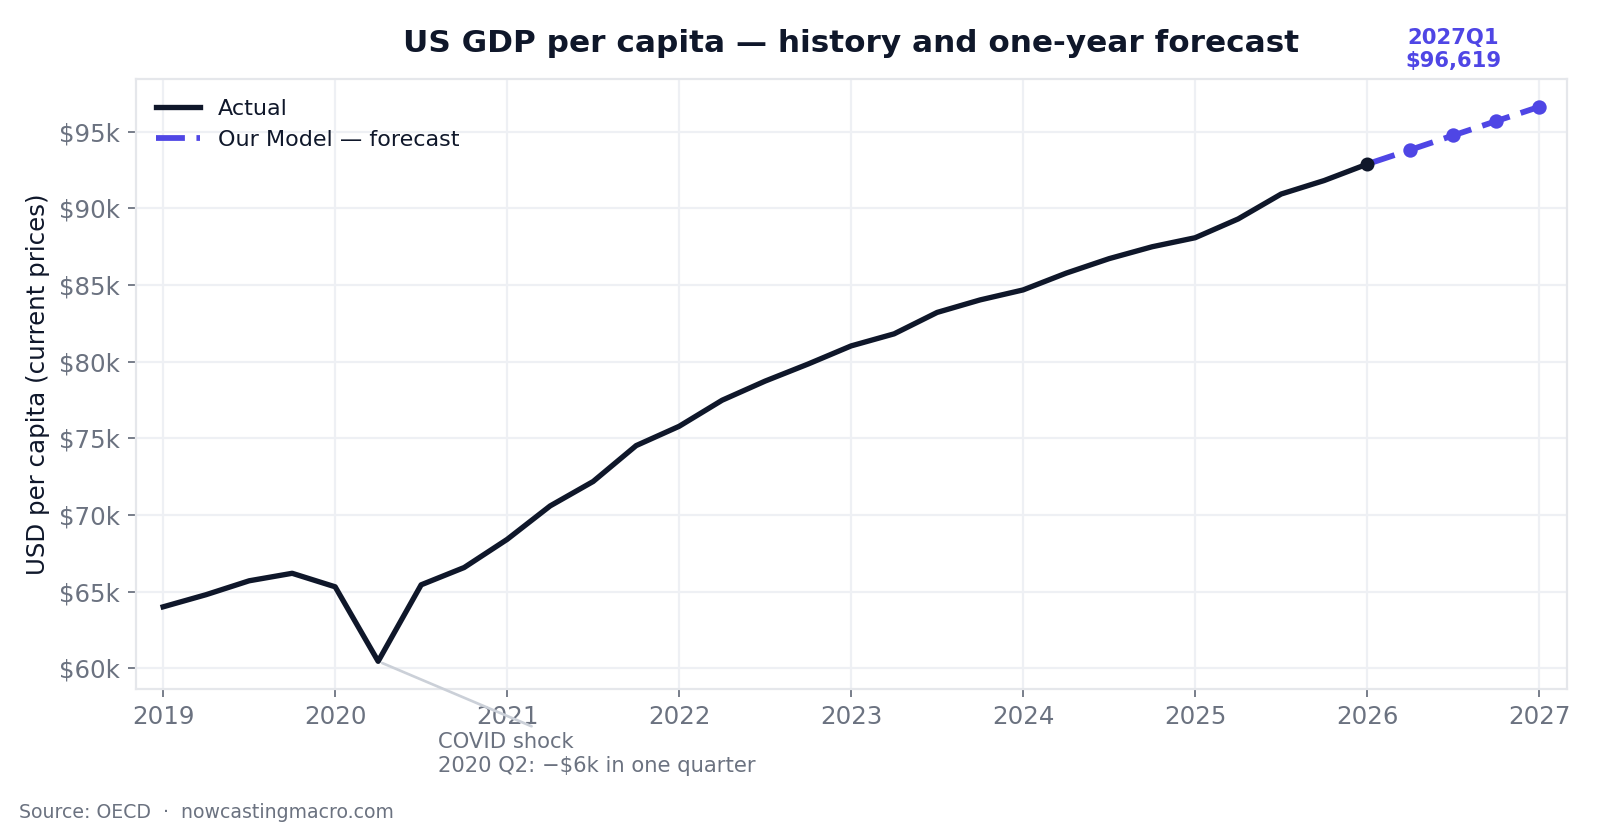
The whole series at a glance: a relentless climb from $64k to $92.9k, one COVID crater in 2020, and our forecast (dashed) continuing to ~$96,600 by early 2027. Underlying data: OECD.
The series: a staircase with one crater
Two features define this series, and together they define the entire forecasting problem.
A powerful upward trend. Quarter after quarter, the number goes up — part real growth, part inflation (this is a current-price dollar figure, a point we'll come back to). Any forecaster that ignores the trend falls progressively, embarrassingly behind.
One catastrophic break. In the second quarter of 2020 the figure fell off a cliff — a $6,000 drop in a single quarter — then snapped back within two quarters. No model on earth forecasts that from the preceding data. The pandemic was not in the time series.
So the job is split-natured: ride a strong trend faithfully, while staying disciplined enough that the occasional shock you can't see coming doesn't wreck you. The model that threads that needle wins.
The tournament: 41 forecasters, scored the honest way
We never hand-pick a model. For every series, every model in our roster competes in a walk-forward backtest: we step through history one quarter at a time, and at each step every model forecasts the next quarter using only the data it would have had then. We score each on how close it got — out of sample, every step, with no peeking at the answer. A model that merely memorises the past has nowhere to hide.
For US GDP per capita, 41 forecasters entered, from dead-simple baselines to heavy statistical and machine-learning machinery. Here's the top of the leaderboard, scored one quarter ahead:
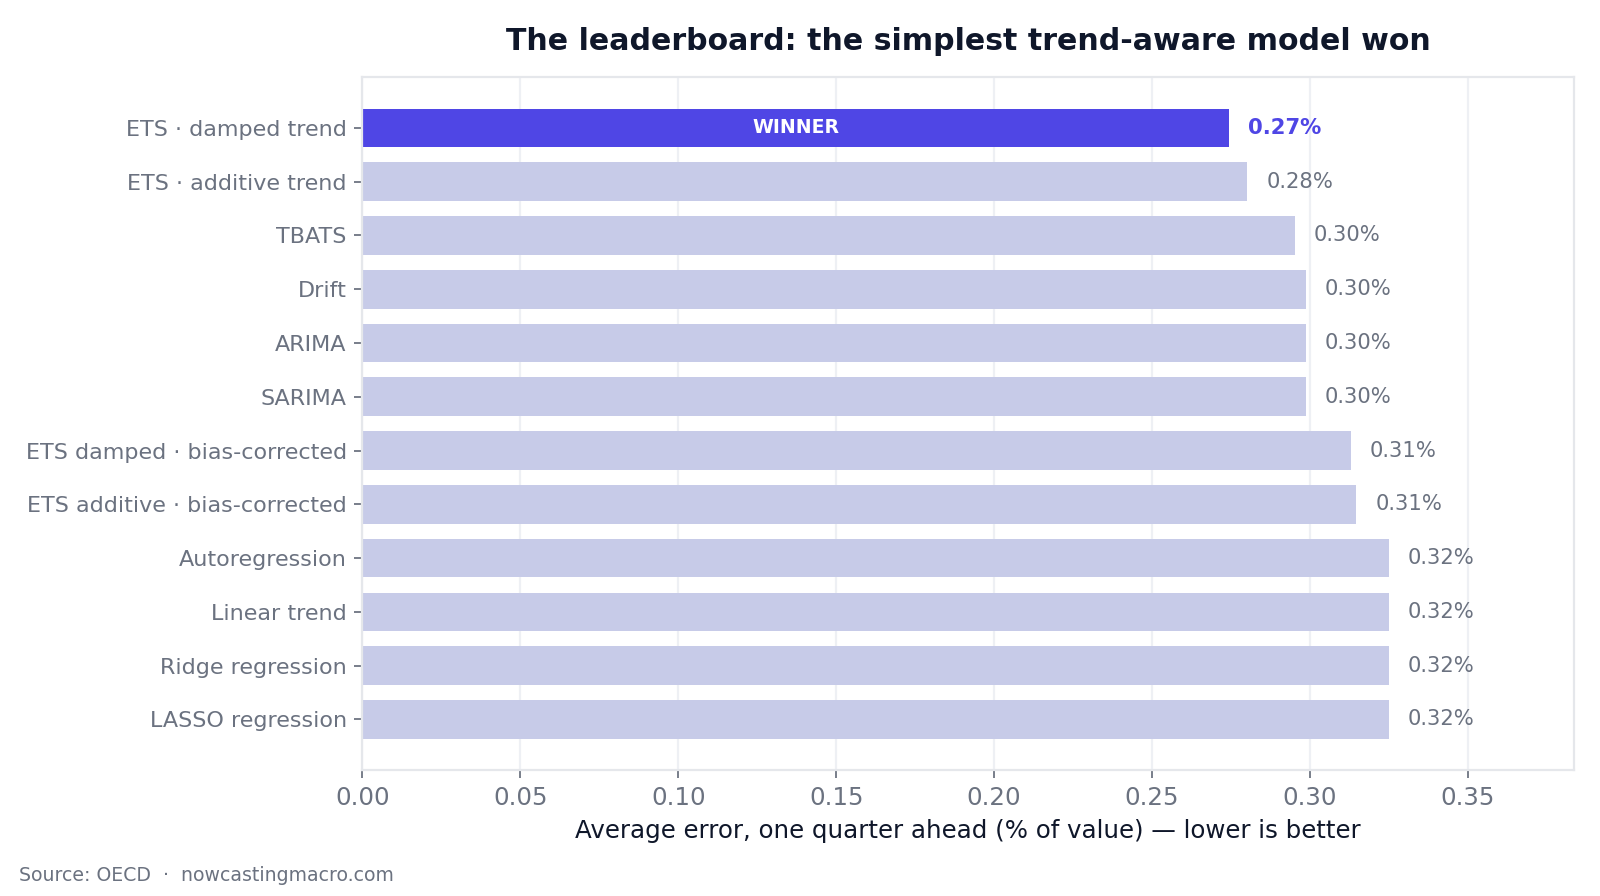
The winner is damped-trend exponential smoothing, at 0.27% error. The full field spanned 0.27% to 13.5% — a fiftyfold gap between the best and worst.
That fiftyfold spread is the most instructive thing on the page. Let's read it from both ends.
Why the winner won: the wisdom of a damped trend
The champion's defining feature is in its name: damped. A plain trend model says "the line went up by $X last quarter, so add $X again — forever." A damped-trend model says something subtler and wiser: "the line is going up, so keep extrapolating it up — but assume the slope gently flattens the further out I look, rather than running in a perfectly straight line to infinity."
That single assumption is almost perfectly suited to GDP per capita. The series does trend up persistently, so you must extrapolate the trend — a model that doesn't will lose. But economies don't accelerate forever in a straight line, so a model that gently restrains its own extrapolation avoids overshooting. Damping is humility encoded as math, and on this series humility is exactly right.
It shows in the result: damped-trend smoothing didn't just win one quarter ahead — it swept all four horizons, the only model to do so:
| Horizon | Champion | Average error |
|---|---|---|
| 1 quarter ahead | ETS · damped trend | 0.27% |
| 2 quarters ahead | ETS · damped trend | 0.41% |
| 3 quarters ahead | ETS · damped trend | 0.49% |
| 4 quarters ahead | ETS · damped trend | 0.51% |
When a model's built-in assumptions genuinely match a series' structure, it doesn't win by luck at a single horizon — it dominates across all of them. That's the signature of a real match, not a fluke. (And notice the error growing smoothly with horizon, roughly doubling from one quarter out to a full year — exactly what honest, leakage-free forecasting should do. If error didn't grow with distance, we'd suspect a bug.)
Why the "smart" models lost: short data punishes complexity
Now read the bottom of the table. The worst performers were the most powerful algorithms — gradient-boosted trees came dead last at 13.5% error, fifty times the winner. These are superb tools when you have tens of thousands of observations. Here we have 29 quarters.
A flexible machine-learning model with 29 data points doesn't discover the trend — it often can't even extrapolate beyond the range it has already seen, because tree-based models predict by averaging past outcomes and have literally never seen a value above the most recent high. On a series whose entire job is to keep setting new records, that's fatal.
There's a quieter casualty worth flagging, too. Plain simple exponential smoothing — the same family as the winner, but with no trend term — finished near the bottom at over four times the winning error. The only difference between first place and the back of the pack is whether the model is allowed to recognise a trend. The recurring lesson of macro forecasting writes itself: a model is only ever as good as its fit to the shape of the problem — and on short macro data, the simplest model that captures that shape usually beats the most powerful one that doesn't.
How closely did it actually track?
Numbers in a table are abstract; here's the backtest drawn out — every forecast made one quarter in advance, against what really happened:
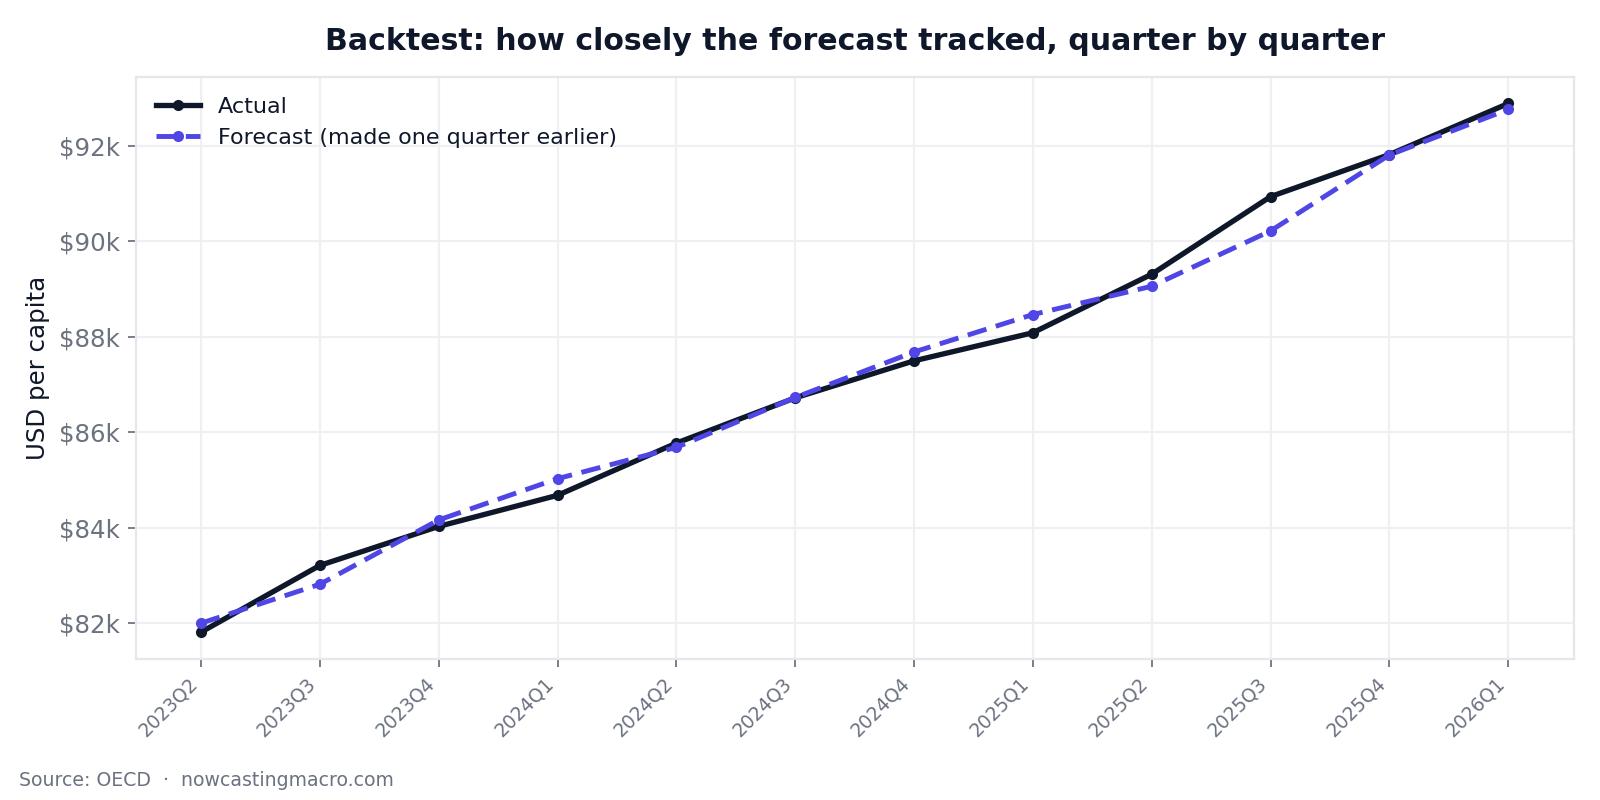
The forecast (dashed indigo) sits almost on top of the actual (black) for three years. The one visible gap — a brief undershoot in late 2025 — is the model behaving exactly as designed.
Most quarters land within a couple hundred dollars; several within ten. The single worst recent miss came in the third quarter of 2025, when growth briefly accelerated (the actual jumped over $1,600 in one quarter). The damped model, by design, didn't fully chase that spurt and undershot by 0.79%. That's the trade-off of damping laid bare: it protects you from overshooting, at the cost of lagging slightly when growth suddenly speeds up. On a series like this, we'll take that trade every time.
What the model says happens next
Off the latest data, the live forecast continues the staircase:
| Quarter | Forecast |
|---|---|
| 2026 Q2 | $93,812 |
| 2026 Q3 | $94,753 |
| 2026 Q4 | $95,688 |
| 2027 Q1 | $96,619 |
The climb keeps going — to roughly $96,600 by early 2027, about 4% above today over the coming year. Two honest caveats belong on that number:
- It's nominal. This is a current-price figure, so a chunk of that 4% is inflation, not rising living standards. Real per-capita growth is the smaller number underneath.
- It assumes no shock. The model extrapolates the trend; it cannot foresee the next 2020. The forecast is the most likely path if the recent regime holds — which is exactly what a forecast should be, provided you say so out loud.
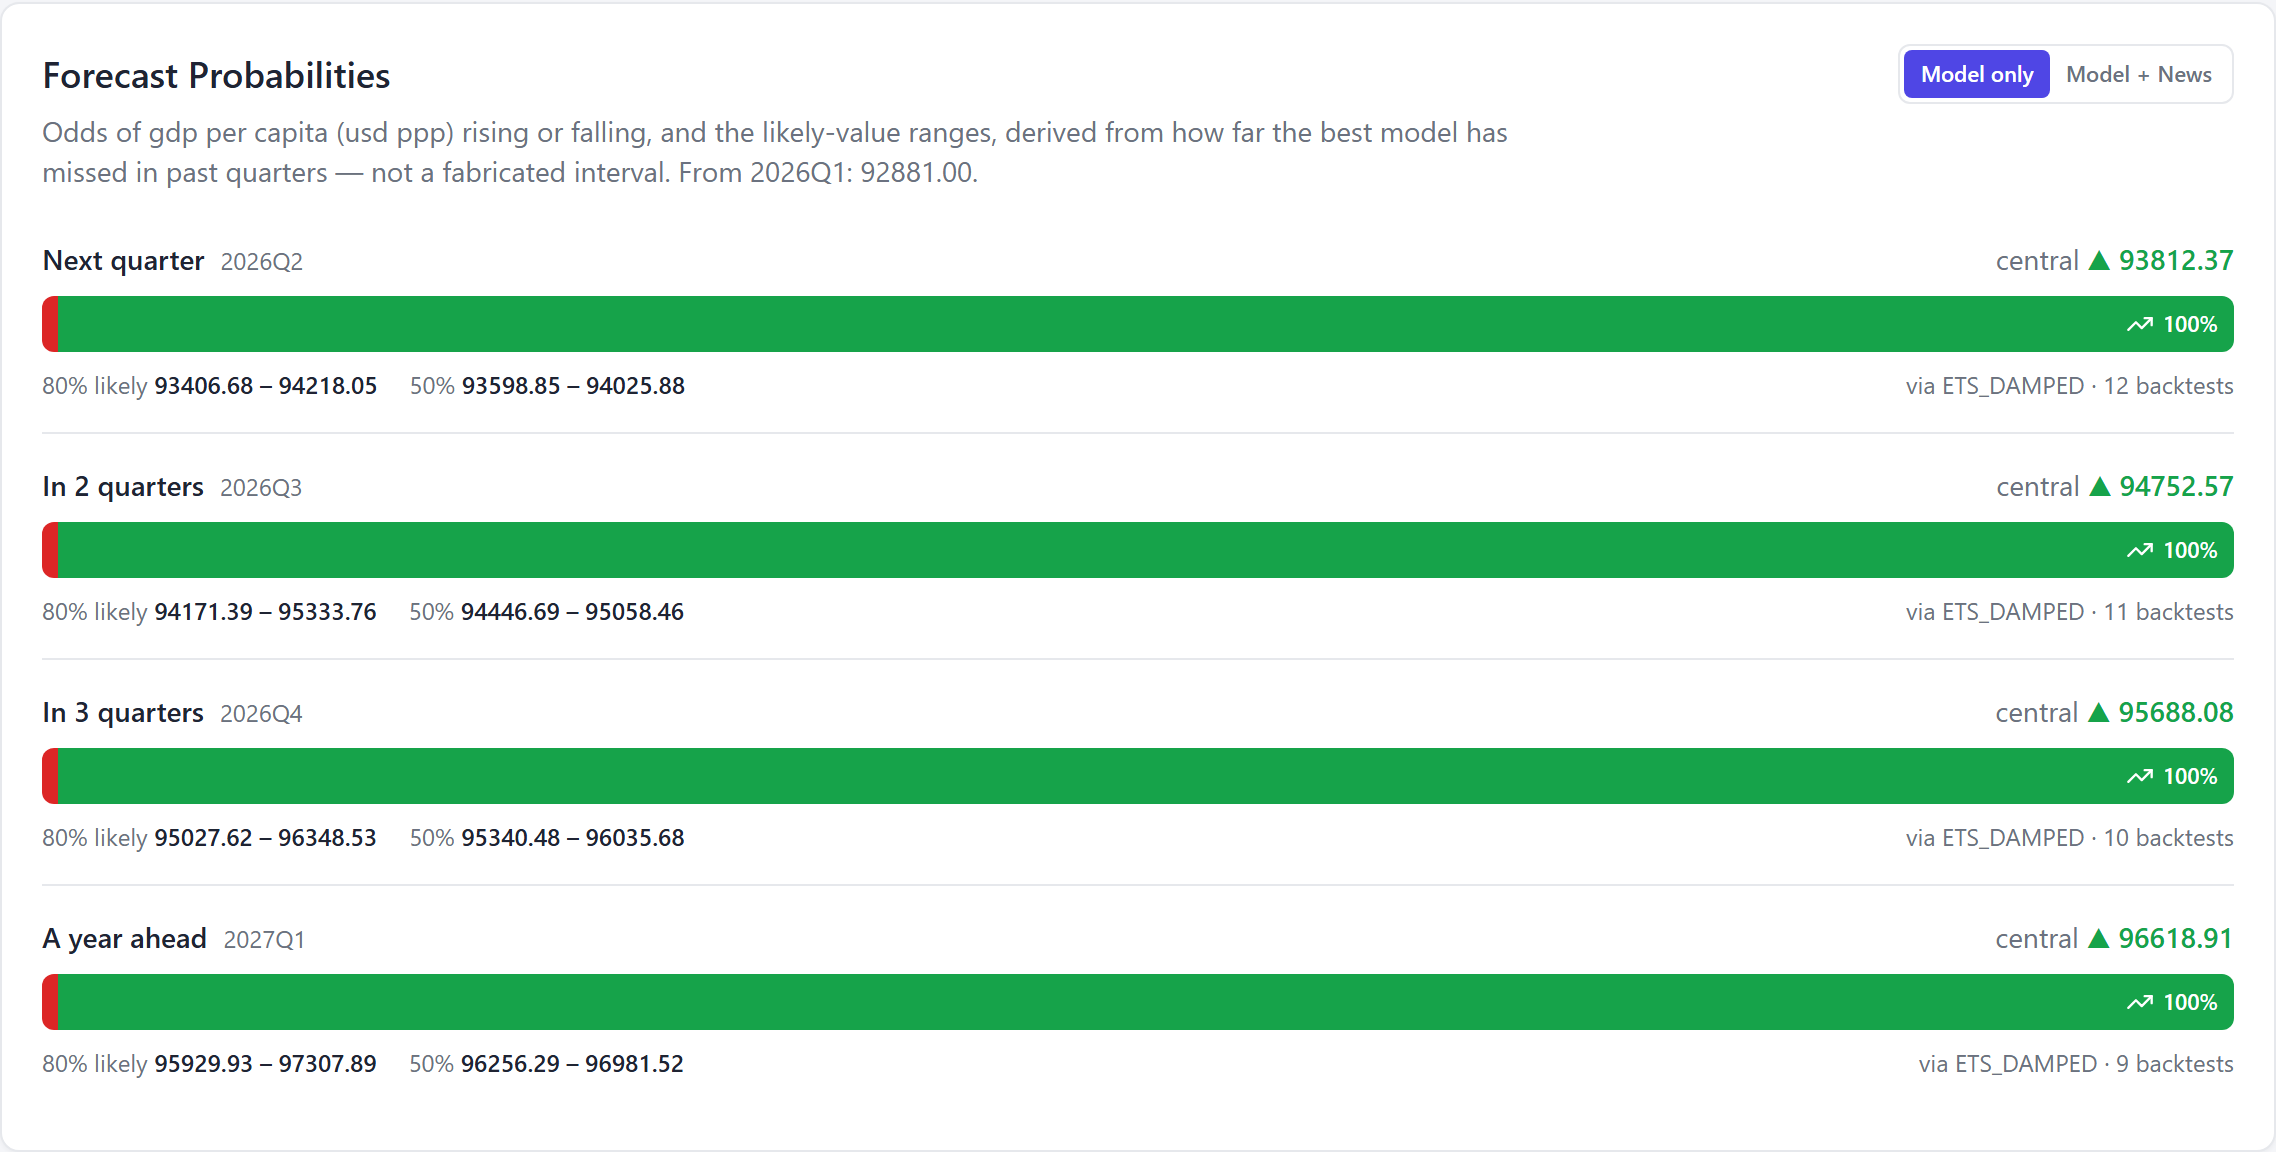
The same forecast, live in the product. The likely-value ranges aren't invented — they're built from how far the model has actually missed in past quarters, so the uncertainty is earned, not assumed.
Anchoring the odds in the news
The forecast above is built purely from the numbers. But we also read the news — every day we collect and score articles about each economy, turning the tone into a single favourable-to-adverse signal. The "Model + News" toggle fuses that signal into the forecast, and it's worth being precise about what it does and doesn't touch.
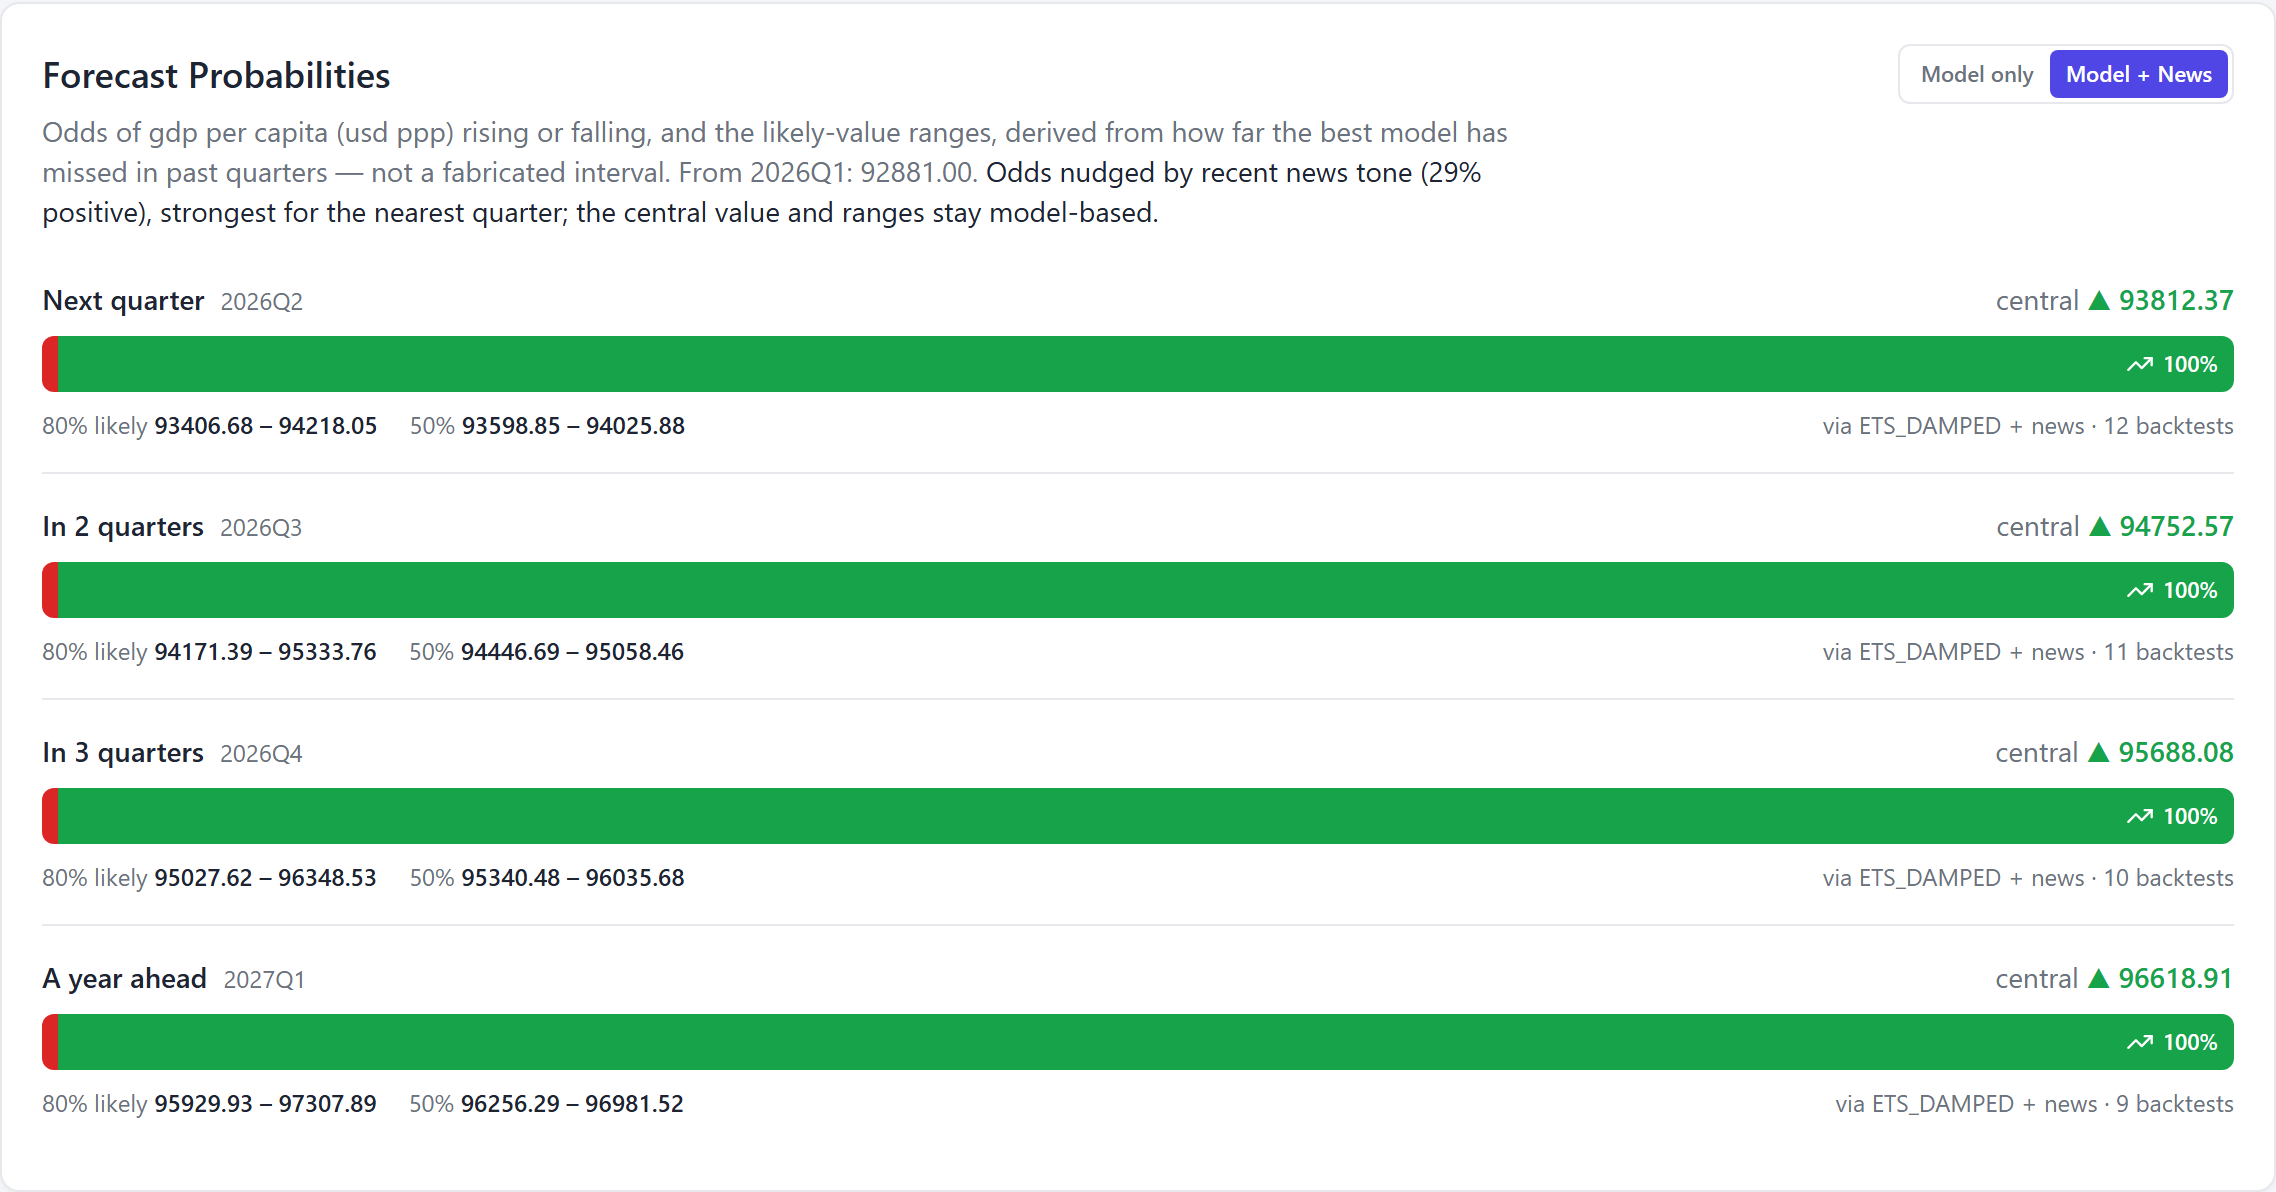
"Model + News" on: the odds are relabelled "via ETS_DAMPED + news" and shift slightly. The central value and the likely-value ranges don't move — only the direction odds.
The rule is deliberately conservative. News tilts the direction odds only, never the central forecast or its ranges, and it does so as a small Bayesian-style update in log-odds space — the same arithmetic a bookmaker uses to shade a line. The nudge decays with horizon, because news is a near-term signal: it has its full say over next quarter and fades to almost nothing a year out.
And the tone isn't asserted — it's counted. Every article on US GDP is read and scored, so the signal feeding the anchor is auditable:

The evidence behind the nudge. Of the recent US-GDP articles, four read positive, eight neutral and zero negative — led by S&P affirming the US AA+ rating (scored "80% positive"). The neutral items are India-focused stories with no direct US read-through, which the relevance scoring correctly discounts. That favourable-but-not-euphoric balance is the *+29 tone the anchor reads — and, since a rise is good news here, it pushes the odds of a rise upward.***
Here's the honest punchline for this particular series: it barely moves anything. The model is already 99.8%+ certain GDP per capita rises (it's a relentless uptrend), so even genuinely positive news can't push near-certain odds any higher — and the tool correctly declines to pretend otherwise. That restraint is the feature. The news anchor earns its keep on choppy, genuinely undecided forecasts — an inflation or confidence reading hovering around a coin-flip — where a week of clearly-toned coverage is real information about which way the next print breaks. On a one-way staircase like US GDP, it simply confirms what the trend already says, and leaves the number untouched.
The forecast doesn't stand alone
We run two further analytical layers on the same data, and they corroborate this one. The standout is Okun's Law — the classic relationship between economic growth and unemployment (faster growth → falling unemployment). For the US it comes out strong: the expected negative link, clearly present in the data (explaining roughly a third of the variation, comfortably significant). So the GDP series we're forecasting isn't an abstract line — it's tied, in a way the data strongly supports, to the US labour market.
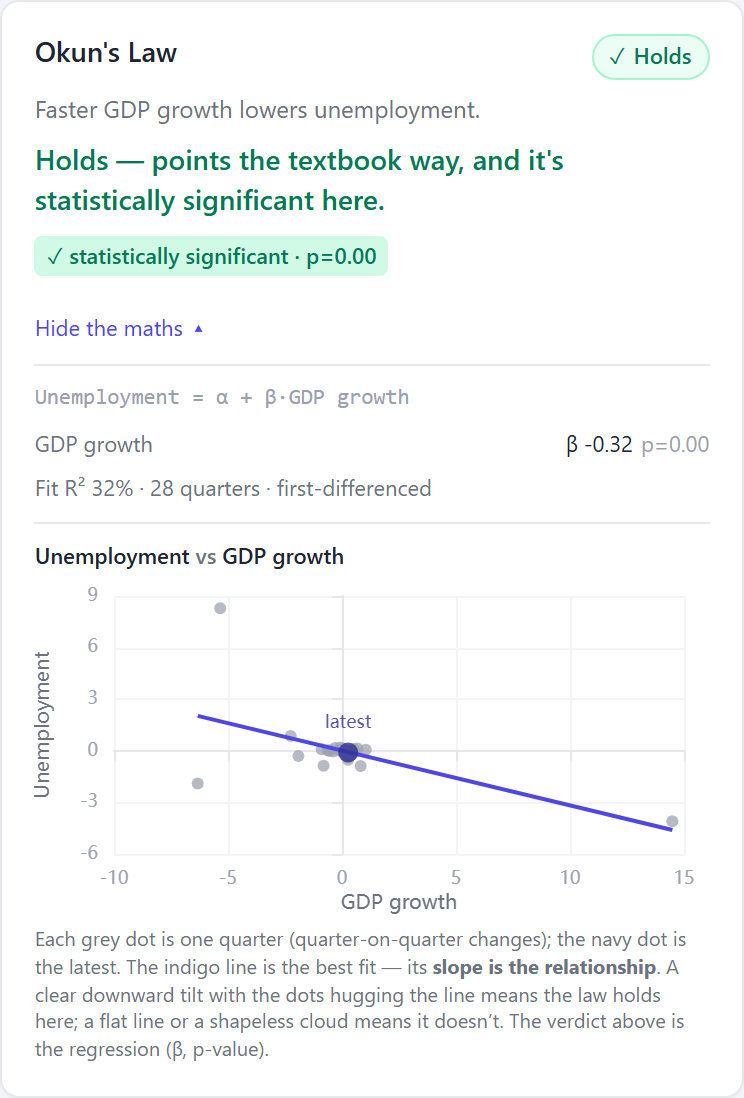
The maths, shown in the product. We estimate Unemployment = α + β · GDP growth on the quarter-on-quarter changes: the slope comes out at β = −0.32 (p < 0.01, R² = 32% over 28 quarters). Each grey dot is a quarter, the navy dot is the latest, and the downward-tilting line is the relationship — faster growth, lower unemployment. The forecast sits on top of structure the data supports.
The US Phillips Curve and the business/consumer confidence relationship also hold significantly. The macro structure around this forecast is coherent, not coincidental.
See it live
Everything above lives in the product. Here's this exact series — US GDP per capita — inside the platform: pick a horizon, read the nowcast, and see the headline accuracy in plain English ("typically within ±240.24").
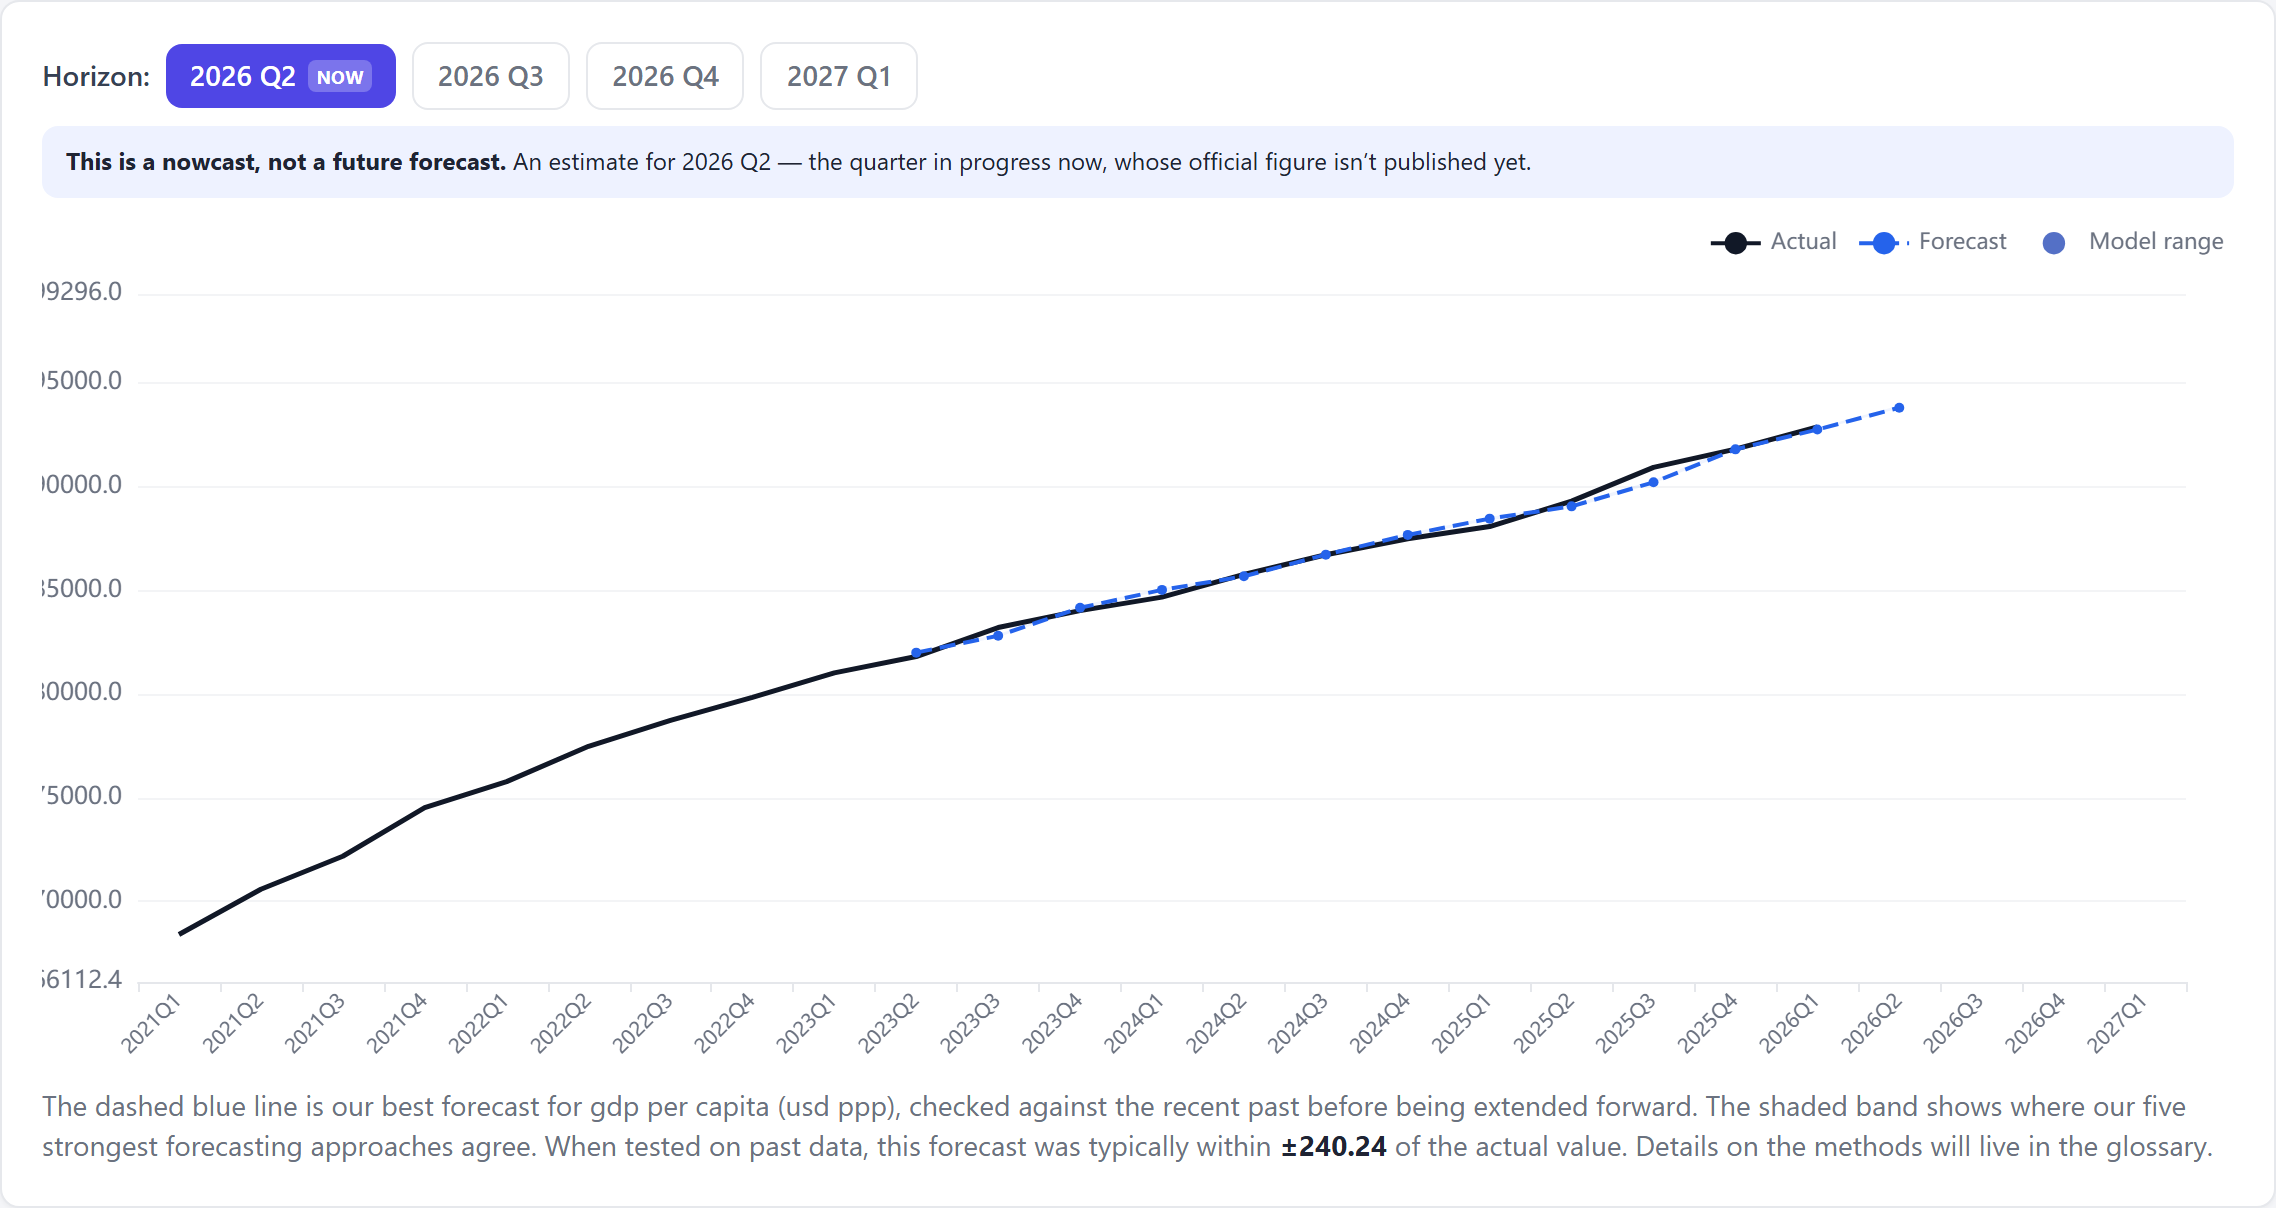
The forecast explorer for US GDP per capita on nowcastingmacro.com. Actual in black, our forecast in blue, with the model-agreement range and an honest, backtested accuracy figure.
The takeaway
The most accurate forecast we make on a genuinely moving series is US GDP per capita, to within 0.27% a quarter ahead. The reasons matter more than the number:
- A trending series can be forecast tightly — not because it's flat, but because it's smooth and persistent. The skill is riding the trend without overshooting.
- A humble model won — damped-trend smoothing assumes growth continues but gently flattens, and it swept every horizon because that assumption fits the data.
- The powerful models lost — tree-based machine learning, with only 29 quarters, can't even extrapolate past its highest seen value, and finished fiftyfold worse.
- The trend term is everything — the same smoother without it fell from first place to the back. A model is only as good as its fit to the shape of the problem.
- The forecast is honest about itself — nominal, not real, and conditional on no fresh shock. The macro laws (Okun, Phillips) corroborate the structure.
Good forecasting isn't about the smallest number or the fanciest model. It's about choosing the model whose assumptions match the world, proving it out of sample, and telling you plainly what the number does and doesn't mean.
This was one series in one country. The same 41-model tournament, walk-forward backtest, and news-anchored probabilities run for every indicator we track — GDP, inflation, unemployment, interest rates, business and consumer confidence, industrial production and retail trade — across 11 major economies: the United States, United Kingdom, Germany, Japan, Canada, Australia, China, India, Brazil, Saudi Arabia and South Africa. Explore the full grid at nowcastingmacro.com.
See the live forecasts, backtests and news-sentiment for every indicator across 11 major economies.
Explore the platform