Why Did the Forecast Change? An Honest Attempt to Decompose a GDP Revision
Every time a forecast moves, it raises a question the forecast itself can't answer: why? We built a pilot layer that tries — decomposing a GDP forecast revision into the macro drivers behind it. This is the honest write-up: how it works, the one country where it genuinely earns its keep, and the several where its biggest bar is labelled "we don't know." We're calling it an attempt for a reason.
Most of what we publish is a forecast — a number, with a backtested error bar, that we'll defend. This is not that. This is a write-up of an experiment: a layer that doesn't forecast anything at all, but tries to explain something the forecasts do.
Here's the question it's chasing. Our GDP forecast for a country isn't a fixed number — it's re-estimated every quarter as new data lands, so it drifts: a small upgrade here, a downgrade there. When the UK's one-quarter-ahead GDP-growth forecast slides from +0.63% to +0.38%, a real question hangs in the air: why did it move? Was it a weaker inflation outlook? Softer industrial production? A wage-growth revision? Or something the model can't put its finger on?
The forecast can't tell you. It outputs a number, not a reason. So we built a separate layer — an attribution layer — to try to crack the revision open and attribute it across the other forecasts that moved alongside it. And the most honest thing we can say up front is that it works in some places and frankly doesn't in others, and we'd rather show you both than quietly ship only the wins.
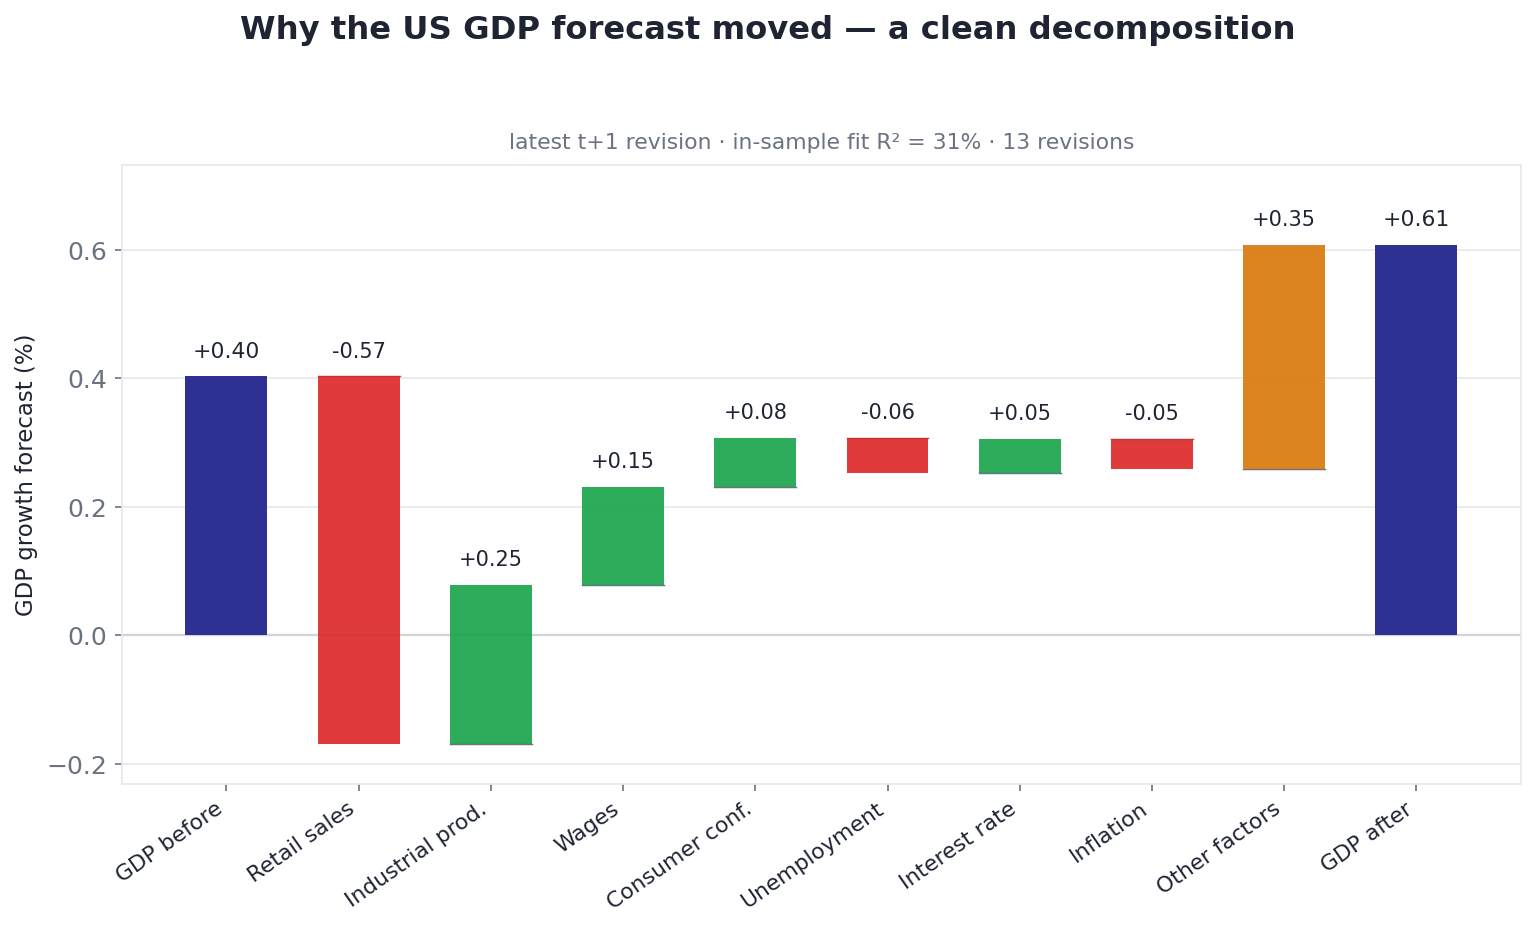
The object we're after: a waterfall that opens up a single forecast revision. The US GDP forecast was nudged up; this chart attributes that move across the macro forecasts that shifted with it — and, crucially, leaves an honest "Other factors" bar for everything the drivers don't explain. Underlying data: OECD; forecasts: the platform's own.
What it is — and emphatically is not
Let's be precise, because the failure mode here is people thinking this is a model that improves the forecast. It is not. The GDP forecast is computed by the main engine and is never touched by this layer. Attribution runs afterwards, read-only, and changes nothing. Its only job is to take a revision that already happened and propose an accounting of it.
That distinction is the whole ethic of the thing. A forecaster is judged on accuracy — did the number come true? An attribution layer is judged on coherence and honesty — does its story hang together, and is it candid about the part it can't explain? Those are different bars, and conflating them is how explainability tools end up lying confidently.
How it works: revisions explaining revisions
The method is deliberately simple, because the data is thin and complexity would just invent structure that isn't there.
1. Snapshots. As the main engine walks forward through history, it leaves a trail of forecasts — at each origin quarter, its best ("champion") one-quarter-ahead call for every macro variable, not just GDP. We line those up: a table of what the forecast for GDP, inflation, wages, unemployment, confidence, industrial production, retail and the rest looked like at each vintage.
2. Revisions. We difference that table down its rows. Each step is a revision — how the forecast for each variable changed from one vintage to the next. After this, GDP's revision history sits alongside the revision history of every potential driver. That's about 13 revisions per country — and that number, you'll notice, is small. Hold that thought.
3. Sensitivities, with theory as a guardrail. We then ask: historically, when these drivers' forecasts were revised, how did GDP's forecast revise with them? That's a regression of GDP's revisions on the drivers' revisions — but a plain regression on 13 noisy points would produce garbage and sign-flips. So we constrain it two ways: - A ridge (Bayesian) prior that shares influence across drivers that move together, instead of arbitrarily crowning one and zeroing the rest. - Theory sign-restrictions — and only signs, never magnitudes. Higher wage growth pushes GDP up; higher unemployment pulls it down (Okun); tighter inflation, a mild drag. The model learns how much from the data, but the direction of each driver is pinned to economics so it can't wander off into a nonsensical sign on a noisy sample.
4. The decomposition. Each driver's contribution is its sensitivity times how much its forecast actually moved: contribution = β × Δforecast. Add them up, subtract from the actual GDP revision, and whatever's left is the residual — "Other factors."
That residual is the most important design choice in the whole thing.
Why we keep an honest residual instead of a tidy 100%
It would have been easy — and dishonest — to force the drivers to explain the entire revision: rescale the contributions so they sum to 100% and call it done. Plenty of explainability tools do exactly that. We refused, for one reason: a forced 100% hides the most useful signal in the data.
By leaving a genuine residual, the waterfall always sums to the real revision exactly, every contribution keeps its honest sign and size, and the "Other factors" bar becomes a live readout of how much of the move the macro story actually captured. A small residual means the drivers explain the revision. A large residual is not a bug to be hidden — it's the model telling you, plainly, "this revision wasn't driven by the macro variables I can see." That's a finding, not an embarrassment. And as you're about to see, on this layer it's often the headline.
Where it works: the United States
Run it on the US, on the latest revision, and you get the encouraging case. The GDP forecast was nudged up by about +0.21 points, and the decomposition tells a readable story:
| US driver | Contribution to the GDP upgrade |
|---|---|
| Industrial production | +0.25 (firmer) |
| Wages | +0.15 |
| Consumer confidence | +0.08 |
| Interest rate | +0.05 |
| Retail sales | −0.57 (a softer retail forecast, pulling the other way) |
| Inflation, unemployment | small, mixed |
| Other factors (residual) | +0.35 |
The US case, where the layer earns its keep: firming industrial-production, wage and confidence forecasts push the GDP call up, partly offset by a softer retail outlook — a coherent, sign-consistent story. In-sample it explains about 31% of the revision history's variation, the highest of any economy we decompose. Even so, "Other factors" is a large bar, and we leave it standing.
This is the layer at its best: every driver sits in its theory-consistent direction, the offsetting tug-of-war between a softer retail outlook and firmer production reads like something an economist would actually say, and the sensitivities explain about 31% of the historical revision variance — the highest of any country we fit. Note that even here, in the best case, "Other factors" is one of the two biggest bars. That restraint is the feature.
Where it doesn't: the United Kingdom, Germany, Japan
Now the honest half. Run the same machine on the UK, and the picture is very different:
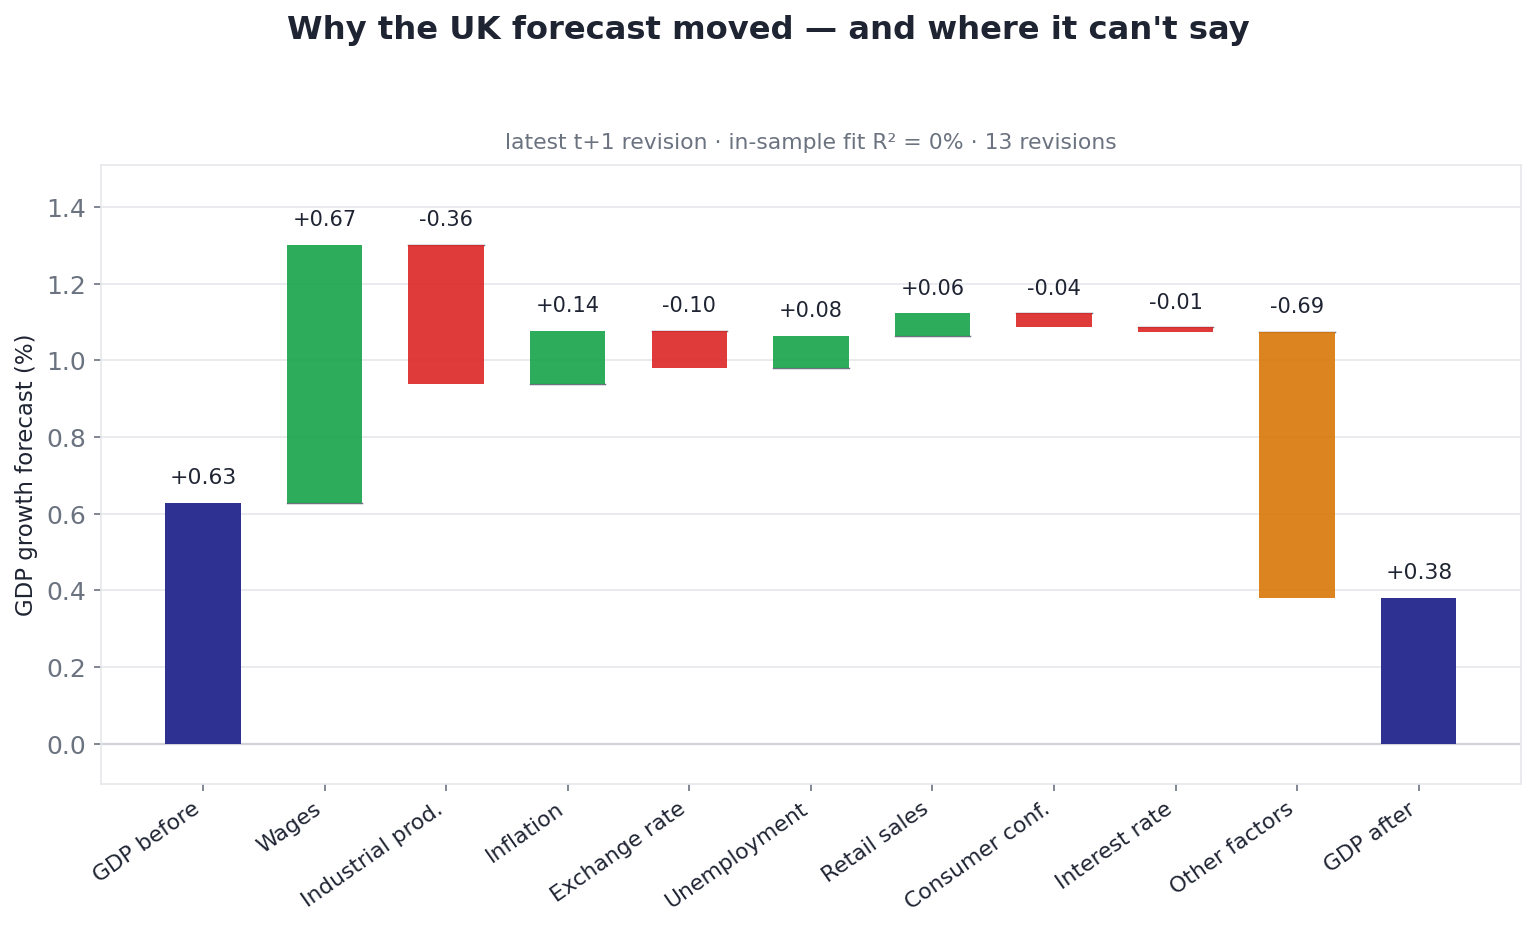
The same method, the UK's latest downgrade — and the residual dominates. The GDP forecast was cut by ~0.25, but the macro forecasts that moved don't account for it (wages were even revised in a way that pulls the other direction). "Other factors" is by far the largest bar, and the in-sample fit is essentially 0%. The model's honest verdict: this downgrade wasn't driven by the drivers it can see.
The UK's GDP forecast was cut by about 0.25 points — but the wage, inflation and confidence forecasts that moved alongside it don't explain the cut; some even moved the wrong way for it. The result is a residual larger than the revision itself, and a regression that explains essentially 0% of the historical variance. Germany tells the same story (residual dominant, ~0% fit); Japan's residual is larger still.
We could bury that. We don't, because a 0% fit is itself the honest answer to the question. When the platform downgraded the UK and the visible macro drivers can't account for it, the right thing for an attribution tool to say is "this wasn't the drivers — look elsewhere," not to manufacture a confident-looking waterfall out of noise. The large residual is the model refusing to pretend.
Across the economies where the drivers do have something to say, the US stands out — with China, South Africa and Japan some way behind:
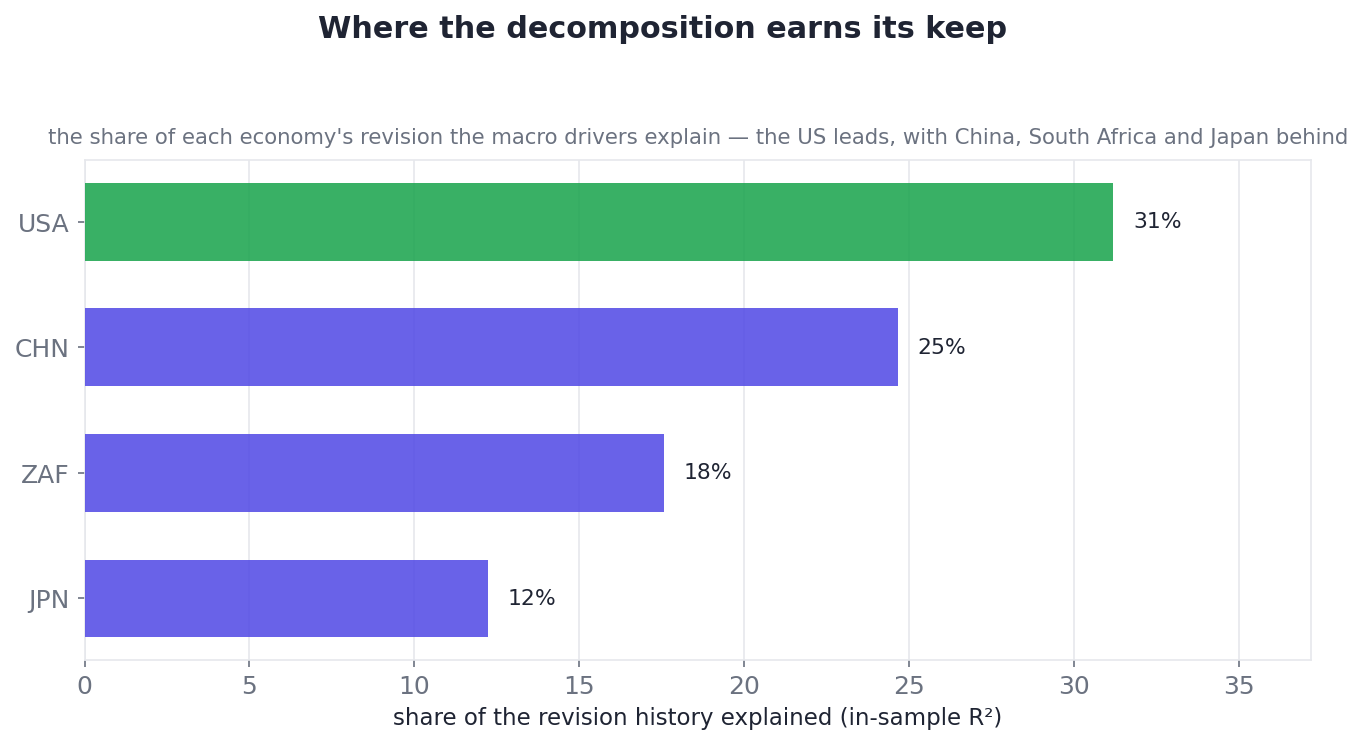
Where the decomposition earns its keep: the share of each economy's revision history that the macro drivers explain. The US leads at ~31%, with China, South Africa and Japan trailing. The economies left off the chart — the UK and Germany you saw above among them — are the ones where the drivers explain essentially none of the revision, and the waterfall is almost all "Other factors."
Why it's hard — and genuinely a pilot
The split between the US case and the UK case isn't bad luck; it's baked into the problem, and naming the reasons is the honest thing to do:
- The sample is tiny. Roughly 13 revisions per country. Estimating a web of sensitivities from 13 noisy points is asking a lot; some countries happen to have a stable, legible revision history (the US), and some are mostly noise over this window (the UK).
- The drivers move together. Inflation, confidence and activity forecasts are revised in concert, so cleanly separating their individual contributions is genuinely hard. The ridge prior shares the influence sensibly, but it can't conjure signal that the short sample doesn't contain.
- Some revisions really are idiosyncratic. Sometimes a forecast moves for reasons that don't show up in the other macro series at all — a one-off data correction, a model-internal shift. When that happens, an honest decomposition should dump most of the move into "Other factors." A large residual is frequently the correct answer, not a failure to find one.
This is why it ships as a pilot, scoped tightly: GDP only, one-quarter-ahead, this fixed set of drivers. The natural next steps — longer horizons, attribution for targets beyond GDP, more history as the backtest deepens — are exactly the things that would move more of those residuals into named bars. We'd rather ship the honest small version than the impressive dishonest one.
See it live
The waterfalls above are generated straight from the live engine — the same one that powers the attribution tab inside the product, where it's computed on the fly the moment you open it: pick a country and the waterfall draws, contributions and residual and all. Where the residual is small, read the drivers; where it's large, the tool is telling you the macro story doesn't explain this one — and that's a legitimate answer. It's a gated tab at nowcastingmacro.com, behind the login.
The takeaway
The GDP-decomposition layer is the most experimental thing on the platform, and the experiment is worth showing precisely because it's honest about its own limits:
- It explains, it doesn't forecast. The GDP forecast is never touched; this runs afterwards, read-only, to account for a revision that already happened.
- Theory pins the signs, data sets the sizes. A ridge prior plus sign-restrictions keep a 13-point regression from sign-flipping into nonsense, without hard-coding any magnitudes.
- The residual is sacred. We refuse to force the drivers to 100%. "Other factors" sums the waterfall to the real revision exactly — and a large residual is a finding ("not the drivers"), not something to hide.
- It works in some places, not others — by design. The US decomposes cleanly (~31% fit); the UK's downgrade is mostly residual (~0% fit). Both are honest answers to "why did it move?"
- It's a pilot, and we say so. Thirteen revisions, collinear drivers, GDP-only scope. The honesty is the product.
The temptation in explainable AI is to always have a confident answer. The harder, better discipline is to build a tool that, when the data genuinely doesn't support a clean story, says so out loud — and leaves the "we don't know" bar standing tall on the chart for everyone to see.
The attribution pilot is one of three analytical layers we run on the same macro data, alongside the macro laws (textbook relationships estimated per country) and the Bayesian scenario planner (what-if shocks across the whole economy). They sit beside the core engine: a 41-model forecasting tournament, walk-forward backtested and news-anchored, running for every indicator we track across the major economies — the United States, United Kingdom, Germany, Japan, Canada, Australia, China, India, Brazil, Saudi Arabia and South Africa. Explore it all at nowcastingmacro.com.
See the live forecasts, backtests and news-sentiment for every indicator across 11 major economies.
Explore the platform